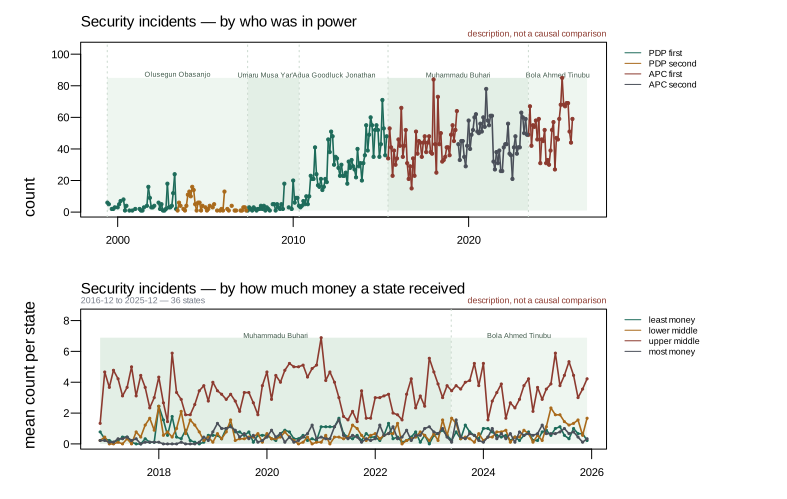
Two ways to look at the same outcome: by who was in power, and by how much money a state received, where the outcome is measured state by state.
Charts describe. Claims live on the estimate screen. A 99-country comparison was tried for under-5 mortality and refused, so no line here is a verdict on a tenure.
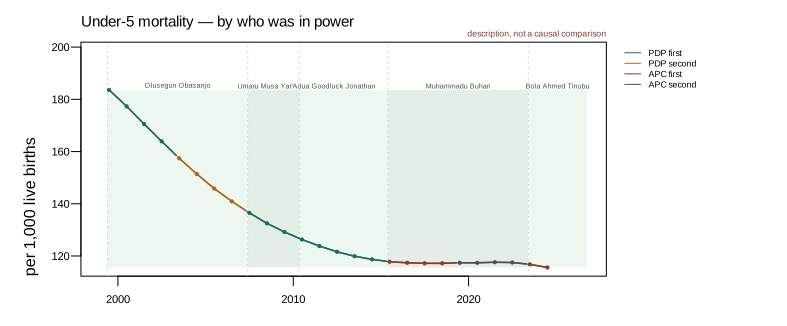
Under-5 mortality rate
Under-5 mortality: 334 months of which 26 observed. Grouped by who was in power (no state grouping is declared for this outcome). Native frequency annual; ok (1999-07 to 2024-07).
What each group's average is
the first PDP term(PDP_first) the first PDP term: 144 months across 3 administrations; 12 with an observation; mean 140.3 a month (142.0 over observed months only).
the second PDP term(PDP_second) the second PDP term: 48 months across 1 administration; 4 with an observation; mean 146.9 a month (148.9 over observed months only).
the first APC term(APC_first) the first APC term: 89 months across 2 administrations; 6 with an observation; mean 117.1 a month (117.0 over observed months only).
the second APC term(APC_second) the second APC term: 48 months across 1 administration; 4 with an observation; mean 117.4 a month (117.5 over observed months only).
No state grouping is declared for this outcome.
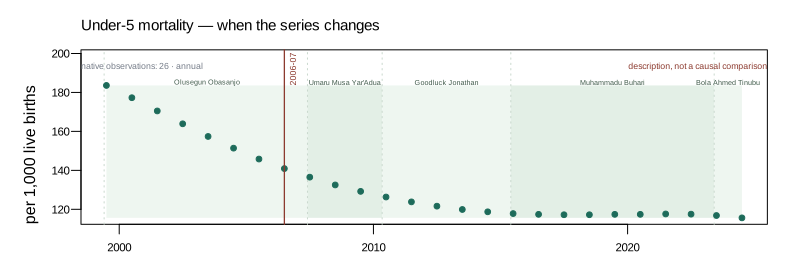
When the series changes
2006-07: Under-5 mortality changes level around 2006-07.
Bai-Perron mean model, 0-1 breaks, BIC over 2m+1 parameters, 1 selected
Each president against the trend
The trend is fitted without ever seeing who was in power. Figures are in per 1,000 live births.
Tenure
Party
Years
Comparison with the president before
Change
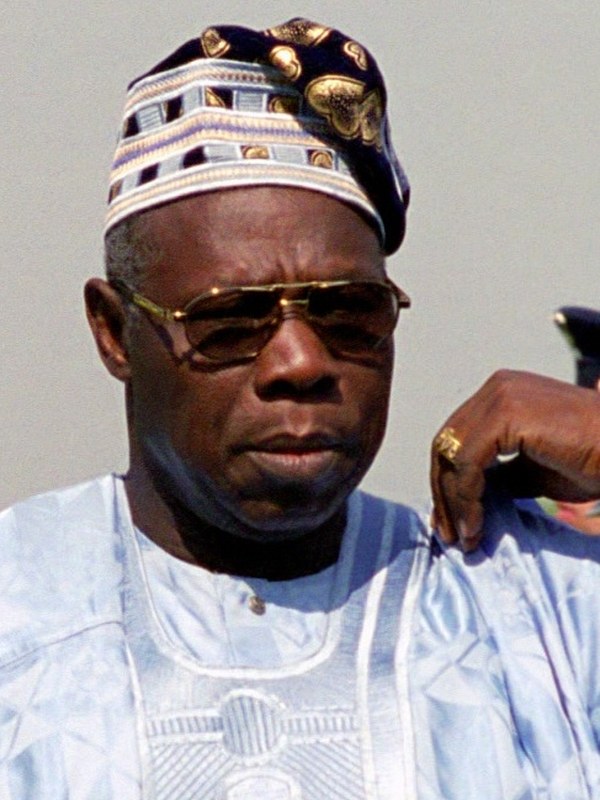
Olusegun Obasanjo
PDP
8
no earlier span
start
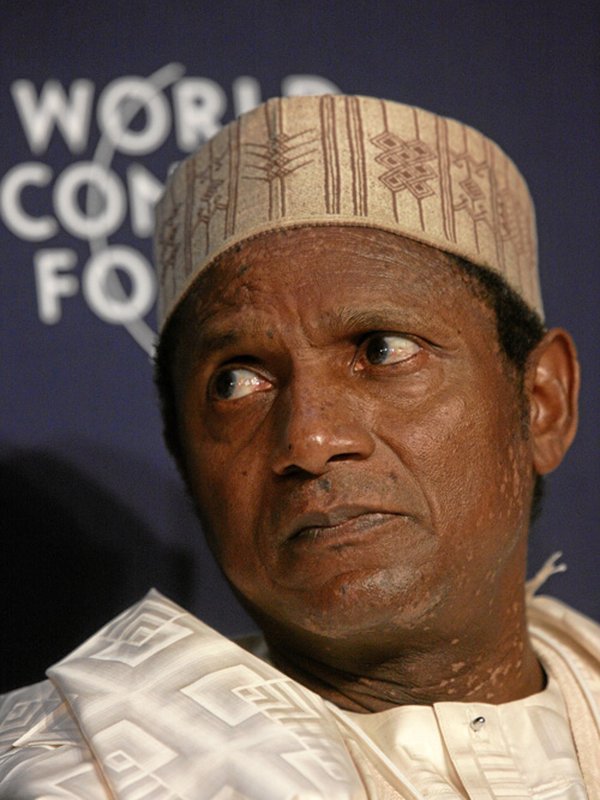
Umaru Musa Yar'Adua
PDP
3
vs Obasanjo: -3.79 [-8.01 … -0.76]
change, good
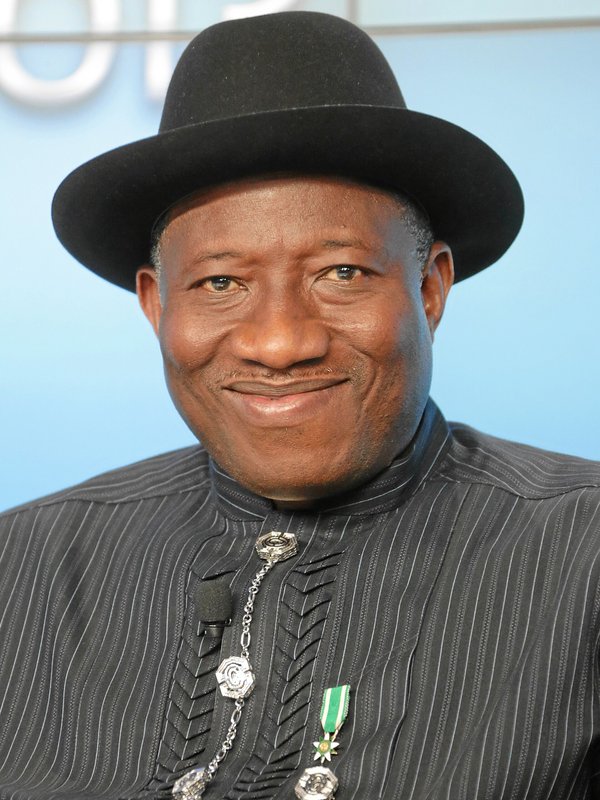
Goodluck Jonathan
PDP
5
vs Yar'Adua: +0.79 [+0.22 … +1.50]
change, bad
Muhammadu Buhari
APC
8
vs Jonathan: +2.46 [+0.95 … +4.59]
change, bad
Furthest from the trend: Umaru Musa Yar'Adua, averaging 3.70 below it. Across all settings, Yar'Adua better than Obasanjo; Jonathan worse than Yar'Adua; Buhari worse than Jonathan.
Largest pairwise contrast. Olusegun Obasanjo sat +3.79 per 1,000 live births from the trend relative to Umaru Musa Yar'Adua, across the declared spans.
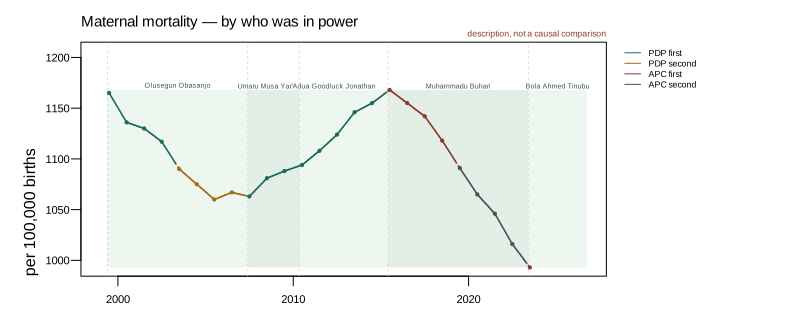
Maternal mortality ratio
Maternal mortality: 334 months of which 25 observed. Grouped by who was in power (no state grouping is declared for this outcome). Native frequency annual; ok (1999-07 to 2023-07).
What each group's average is
the first PDP term(PDP_first) the first PDP term: 144 months across 3 administrations; 12 with an observation; mean 1,117.8 a month (1,117.2 over observed months only).
the second PDP term(PDP_second) the second PDP term: 48 months across 1 administration; 4 with an observation; mean 1,070.5 a month (1,073.0 over observed months only).
the first APC term(APC_first) the first APC term: 89 months across 2 administrations; 5 with an observation; mean 1,132.7 a month (1,115.2 over observed months only).
the second APC term(APC_second) the second APC term: 48 months across 1 administration; 4 with an observation; mean 1,045.3 a month (1,054.5 over observed months only).
No state grouping is declared for this outcome.
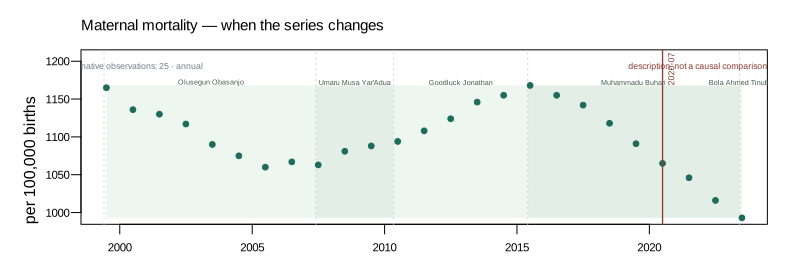
When the series changes
2020-07: Maternal mortality changes level around 2020-07.
Bai-Perron mean model, 0-1 breaks, BIC over 2m+1 parameters, 1 selected
Each president against the trend
The trend is fitted without ever seeing who was in power. Figures are in per 100,000 births.
Tenure
Party
Years
Comparison with the president before
Change
Olusegun Obasanjo
PDP
8
no earlier span
start
Umaru Musa Yar'Adua
PDP
3
vs Obasanjo: -13.60 [-28.52 … -1.10]
change, good
Goodluck Jonathan
PDP
5
vs Yar'Adua: +27.84 [+9.25 … +48.80]
change, bad
Muhammadu Buhari
APC
8
vs Jonathan: +2.90 [-4.48 … +6.65]
no change, neutral
Furthest from the trend: Umaru Musa Yar'Adua, averaging 17.44 below it. Across all settings, Yar'Adua better than Obasanjo; Jonathan worse than Yar'Adua. The move from Jonathan to Buhari is not consistent across settings, so it is neutral.
Largest pairwise contrast. Umaru Musa Yar'Adua sat -30.74 per 100,000 births from the trend relative to Muhammadu Buhari, across the declared spans.
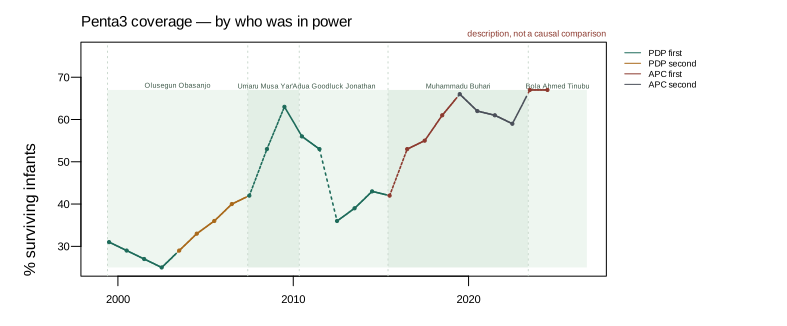
Penta3 immunisation coverage
Penta3 coverage: 334 months of which 26 observed. Grouped by who was in power (no state grouping is declared for this outcome). Native frequency annual; flagged (1999-07 to 2024-07).
What each group's average is
the first PDP term(PDP_first) the first PDP term: 144 months across 3 administrations; 12 with an observation; mean 41.4 a month.
the second PDP term(PDP_second) the second PDP term: 48 months across 1 administration; 4 with an observation; mean 35.7 a month (34.5 over observed months only).
the first APC term(APC_first) the first APC term: 89 months across 2 administrations; 6 with an observation; mean 57.7 a month (57.5 over observed months only).
the second APC term(APC_second) the second APC term: 48 months across 1 administration; 4 with an observation; mean 62.1 a month (62.0 over observed months only).
No state grouping is declared for this outcome.
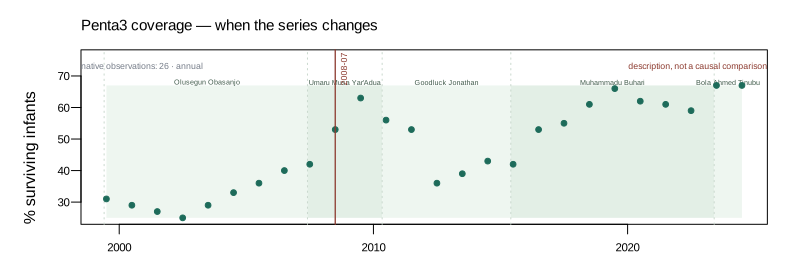
When the series changes
2008-07: Penta3 coverage changes level around 2008-07.
Bai-Perron mean model, 0-1 breaks, BIC over 2m+1 parameters, 1 selected
Each president against the trend
The trend is fitted without ever seeing who was in power. Figures are in % surviving infants.
Tenure
Party
Years
Comparison with the president before
Change
Olusegun Obasanjo
PDP
8
no earlier span
start
Umaru Musa Yar'Adua
PDP
3
vs Obasanjo: +9.87 [+6.48 … +12.77]
change, good
Goodluck Jonathan
PDP
5
vs Yar'Adua: -11.19 [-13.77 … -7.66]
change, bad
Muhammadu Buhari
APC
8
vs Jonathan: +2.77 [+2.52 … +3.07]
change, good
Furthest from the trend: Umaru Musa Yar'Adua, averaging 8.41 above it. Across all settings, Yar'Adua better than Obasanjo; Jonathan worse than Yar'Adua; Buhari better than Jonathan.
Largest pairwise contrast. Umaru Musa Yar'Adua sat +11.19 % surviving infants from the trend relative to Goodluck Jonathan, across the declared spans.
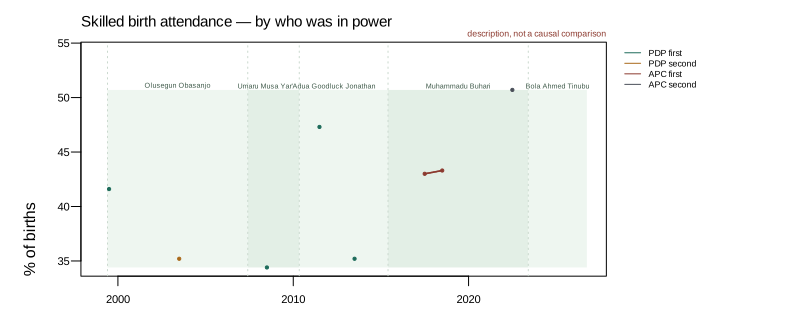
Skilled birth attendance
Skilled birth attendance: 334 months of which 8 observed. Grouped by who was in power (no state grouping is declared for this outcome). Native frequency annual; flagged (1999-07 to 2022-07).
What each group's average is
the first PDP term(PDP_first) the first PDP term: 144 months across 3 administrations; 4 with an observation; mean 39.6 a month.
the second PDP term(PDP_second) the second PDP term: 48 months across 1 administration; 1 with an observation; mean 35.2 a month.
the first APC term(APC_first) the first APC term: 89 months across 2 administrations; 2 with an observation; mean 43.1 a month.
the second APC term(APC_second) the second APC term: 48 months across 1 administration; 1 with an observation; mean 50.7 a month.
No state grouping is declared for this outcome.
When the series changes
Skilled birth attendance: 8 native observations in the window. Too few to say when the series changes, and the stage does not fit a date it was told to find.
Each president against the trend
A trend needs at least 20 native observations, and this series has 8.
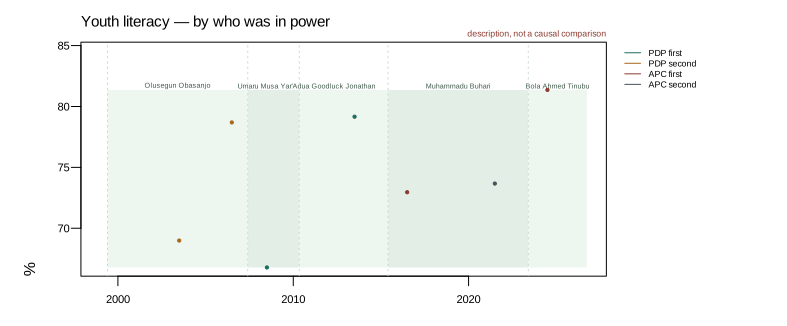
Youth literacy (15-24)
Youth literacy: 334 months of which 7 observed. Grouped by who was in power (no state grouping is declared for this outcome). Native frequency annual; flagged (2003-07 to 2024-07).
What each group's average is
the first PDP term(PDP_first) the first PDP term: 144 months across 3 administrations; 2 with an observation; mean 73.0 a month.
the second PDP term(PDP_second) the second PDP term: 48 months across 1 administration; 2 with an observation; mean 73.8 a month.
the first APC term(APC_first) the first APC term: 89 months across 2 administrations; 2 with an observation; mean 77.2 a month.
the second APC term(APC_second) the second APC term: 48 months across 1 administration; 1 with an observation; mean 73.7 a month.
No state grouping is declared for this outcome.
When the series changes
Youth literacy: 7 native observations in the window. Too few to say when the series changes, and the stage does not fit a date it was told to find.
Each president against the trend
A trend needs at least 20 native observations, and this series has 7.
Primary completion rate
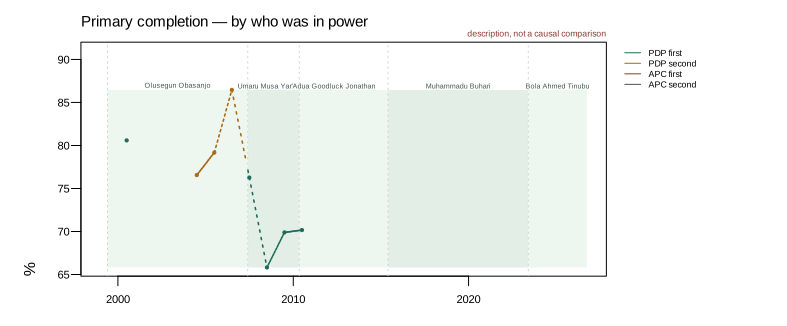
Primary completion: 334 months of which 8 observed. Grouped by who was in power (no state grouping is declared for this outcome). Native frequency annual; flagged (2000-07 to 2010-07).
What each group's average is
the first PDP term(PDP_first) the first PDP term: 144 months across 3 administrations; 5 with an observation; mean 70.2 a month (72.5 over observed months only).
the second PDP term(PDP_second) the second PDP term: 48 months across 1 administration; 3 with an observation; mean 80.8 a month (80.7 over observed months only).
the first APC term(APC_first) the first APC term: 89 months across 2 administrations; 0 with an observation; mean no observation a month.
the second APC term(APC_second) the second APC term: 48 months across 1 administration; 0 with an observation; mean no observation a month.
No state grouping is declared for this outcome.
When the series changes
Primary completion: 8 native observations in the window. Too few to say when the series changes, and the stage does not fit a date it was told to find.
Each president against the trend
A trend needs at least 20 native observations, and this series has 8.
Net enrolment rate, primary
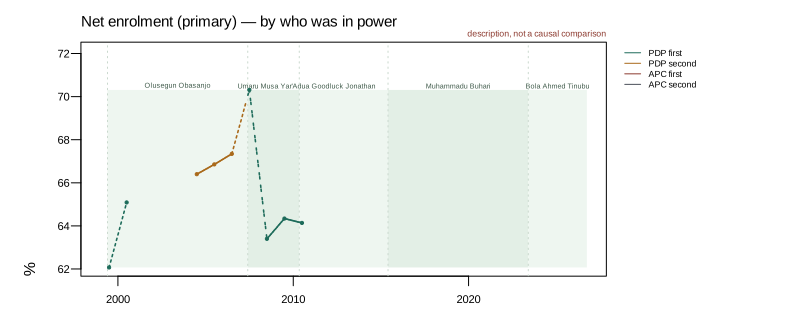
Net enrolment (primary): 334 months of which 9 observed. Grouped by who was in power (no state grouping is declared for this outcome). Native frequency annual; flagged (1999-07 to 2010-07).
What each group's average is
the first PDP term(PDP_first) the first PDP term: 144 months across 3 administrations; 6 with an observation; mean 64.8 a month (64.9 over observed months only).
the second PDP term(PDP_second) the second PDP term: 48 months across 1 administration; 3 with an observation; mean 67.4 a month (66.9 over observed months only).
the first APC term(APC_first) the first APC term: 89 months across 2 administrations; 0 with an observation; mean no observation a month.
the second APC term(APC_second) the second APC term: 48 months across 1 administration; 0 with an observation; mean no observation a month.
No state grouping is declared for this outcome.
When the series changes
Net enrolment (primary): 9 native observations in the window. Too few to say when the series changes, and the stage does not fit a date it was told to find.
Each president against the trend
A trend needs at least 20 native observations, and this series has 9.
Reported security fatalities
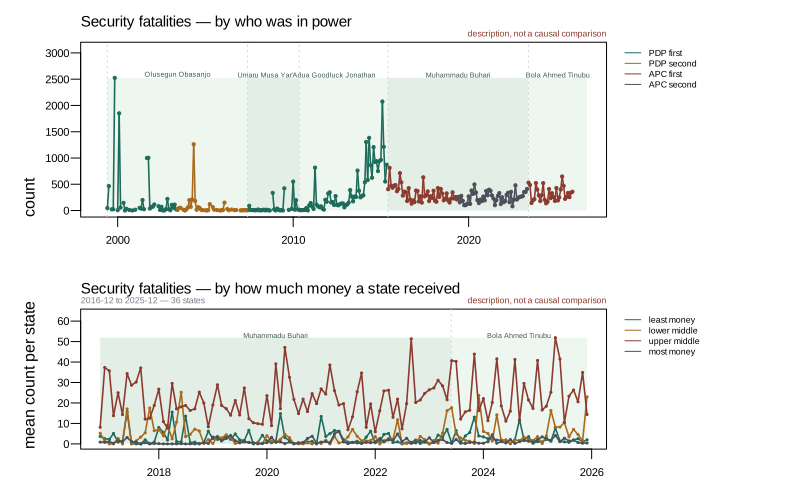
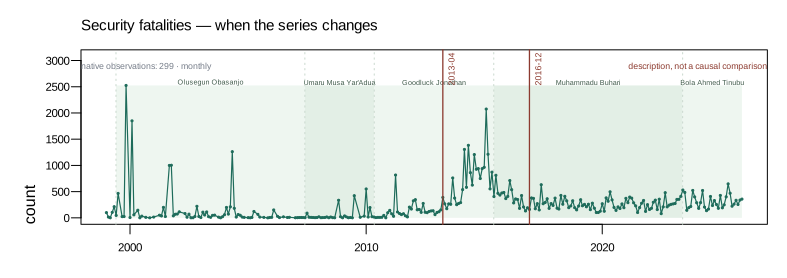
Security fatalities: 334 months of which 299 observed. Grouped both by who was in power and by state allocation (2016-12 to 2025-12).
What each group's average is
the first PDP term(PDP_first) the first PDP term: 144 months across 3 administrations; 129 with an observation; mean 262.8 a month.
the second PDP term(PDP_second) the second PDP term: 48 months across 1 administration; 38 with an observation; mean 72.9 a month.
the first APC term(APC_first) the first APC term: 89 months across 2 administrations; 79 with an observation; mean 321.0 a month.
the second APC term(APC_second) the second APC term: 48 months across 1 administration; 48 with an observation; mean 254.0 a month.
states that received the least federal money(FAAC dose quartile 1 (lowest)) states that received the least federal money (9 states): 109 months, 109 with at least one observed state; mean 3.0 per state-month.
states in the lower middle(FAAC dose quartile 2) states in the lower middle (9 states): 109 months, 109 with at least one observed state; mean 4.0 per state-month.
states in the upper middle(FAAC dose quartile 3) states in the upper middle (9 states): 109 months, 109 with at least one observed state; mean 22.3 per state-month.
states that received the most federal money(FAAC dose quartile 4 (highest)) states that received the most federal money (9 states): 109 months, 109 with at least one observed state; mean 1.3 per state-month.
When the series changes
2013-04: Security fatalities changes level around 2013-04.
2016-12: Security fatalities changes level around 2016-12.
Bai-Perron mean model, 0-2 breaks, BIC over 2m+1 parameters, 2 selected
Each president against the trend
The trend is fitted without ever seeing who was in power. Figures are in count.
Tenure
Party
Months
Comparison with the president before
Change
Olusegun Obasanjo
PDP
76
no earlier span
start
Umaru Musa Yar'Adua
PDP
33
vs Obasanjo: -107.91 [-158.50 … -37.61]
change, good
Goodluck Jonathan
PDP
61
vs Yar'Adua: +209.99 [+115.06 … +283.19]
change, bad
Muhammadu Buhari
APC
97
vs Jonathan: -135.76 [-153.37 … -113.37]
change, good
Bola Ahmed Tinubu
APC
32
vs Buhari: +44.23 [-10.82 … +75.74]
no change, neutral
Furthest from the trend: Goodluck Jonathan, averaging 106.34 above it. Across all settings, Yar'Adua better than Obasanjo; Jonathan worse than Yar'Adua; Buhari better than Jonathan. The move from Buhari to Tinubu is not consistent across settings, so it is neutral.
Largest pairwise contrast. Umaru Musa Yar'Adua sat -209.99 count from the trend relative to Goodluck Jonathan, across the declared spans.
Reported security incidents
Security incidents: 334 months of which 299 observed. Grouped both by who was in power and by state allocation (2016-12 to 2025-12).
What each group's average is
the first PDP term(PDP_first) the first PDP term: 144 months across 3 administrations; 129 with an observation; mean 16.7 a month.
the second PDP term(PDP_second) the second PDP term: 48 months across 1 administration; 38 with an observation; mean 4.2 a month.
the first APC term(APC_first) the first APC term: 89 months across 2 administrations; 79 with an observation; mean 45.6 a month.
the second APC term(APC_second) the second APC term: 48 months across 1 administration; 48 with an observation; mean 46.1 a month.
states that received the least federal money(FAAC dose quartile 1 (lowest)) states that received the least federal money (9 states): 109 months, 109 with at least one observed state; mean 0.6 per state-month.
states in the lower middle(FAAC dose quartile 2) states in the lower middle (9 states): 109 months, 109 with at least one observed state; mean 0.6 per state-month.
states in the upper middle(FAAC dose quartile 3) states in the upper middle (9 states): 109 months, 109 with at least one observed state; mean 3.5 per state-month.
states that received the most federal money(FAAC dose quartile 4 (highest)) states that received the most federal money (9 states): 109 months, 109 with at least one observed state; mean 0.5 per state-month.
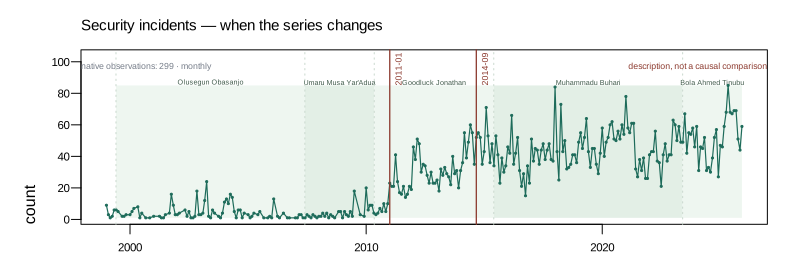
When the series changes
2011-01: Security incidents changes level around 2011-01.
2014-09: Security incidents changes level around 2014-09.
Bai-Perron mean model, 0-2 breaks, BIC over 2m+1 parameters, 2 selected
Each president against the trend
The trend is fitted without ever seeing who was in power. Figures are in count.
Tenure
Party
Months
Comparison with the president before
Change
Olusegun Obasanjo
PDP
76
no earlier span
start
Umaru Musa Yar'Adua
PDP
33
vs Obasanjo: -9.89 [-13.30 … -5.86]
change, good
Goodluck Jonathan
PDP
61
vs Yar'Adua: +13.27 [+9.15 … +16.46]
change, bad
Muhammadu Buhari
APC
97
vs Jonathan: -3.34 [-3.59 … -2.95]
change, good
Bola Ahmed Tinubu
APC
32
vs Buhari: -1.73 [-5.32 … +1.21]
no change, neutral
Furthest from the trend: Umaru Musa Yar'Adua, averaging 9.49 below it. Across all settings, Yar'Adua better than Obasanjo; Jonathan worse than Yar'Adua; Buhari better than Jonathan. The move from Buhari to Tinubu is not consistent across settings, so it is neutral.
Largest pairwise contrast. Umaru Musa Yar'Adua sat -13.27 count from the trend relative to Goodluck Jonathan, across the declared spans.
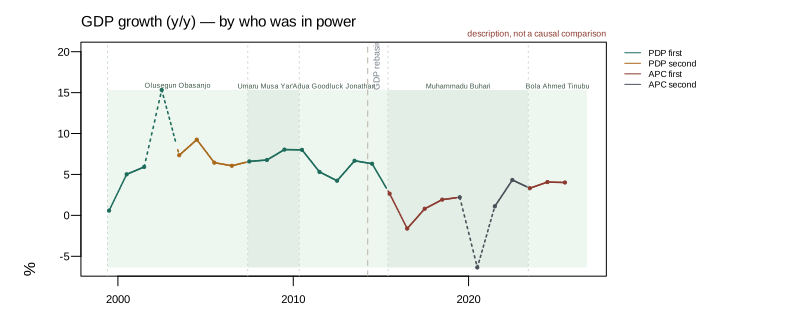
Real GDP growth (y/y)
GDP growth (y/y): 334 months of which 27 observed. Grouped by who was in power (no state grouping is declared for this outcome). Native frequency annual; ok (1999-07 to 2025-07).
What each group's average is
the first PDP term(PDP_first) the first PDP term: 144 months across 3 administrations; 12 with an observation; mean 6.7 a month (6.6 over observed months only).
the second PDP term(PDP_second) the second PDP term: 48 months across 1 administration; 4 with an observation; mean 7.2 a month (7.3 over observed months only).
the first APC term(APC_first) the first APC term: 89 months across 2 administrations; 7 with an observation; mean 1.9 a month (2.2 over observed months only).
the second APC term(APC_second) the second APC term: 48 months across 1 administration; 4 with an observation; mean 0.4 a month (0.3 over observed months only).
No state grouping is declared for this outcome.
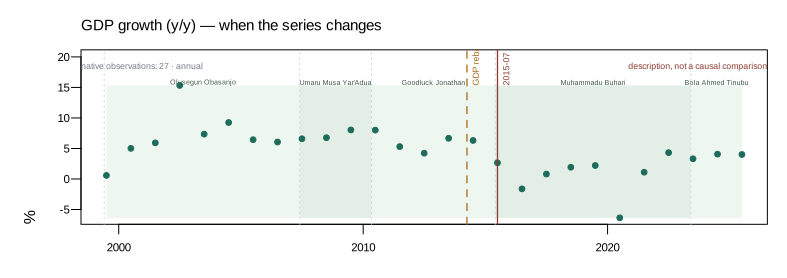
When the series changes
2014-04: The series is measured differently from 2014-04 (GDP rebasing).
2015-07: GDP growth (y/y) changes level around 2015-07. (A break within two months of a swearing-in is recorded as timing only.)
Bai-Perron mean model, 0-1 breaks, BIC over 2m+1 parameters, 1 selected
Each president against the trend
The trend is fitted without ever seeing who was in power. Figures are percentages.
Tenure
Party
Years
Comparison with the president before
Change
Olusegun Obasanjo
PDP
8
no earlier span
start
Umaru Musa Yar'Adua
PDP
3
vs Obasanjo: +0.52 [+0.06 … +1.36]
change, good
Goodluck Jonathan
PDP
5
vs Yar'Adua: +0.56 [+0.24 … +0.93]
change, good
Muhammadu Buhari
APC
8
vs Jonathan: -2.76 [-3.46 … -1.76]
change, bad
Bola Ahmed Tinubu
APC
3
vs Buhari: +3.27 [+1.36 … +4.71]
change, good
Furthest from the trend: Bola Ahmed Tinubu, averaging 1.68 above it. Across all settings, Yar'Adua better than Obasanjo; Jonathan better than Yar'Adua; Buhari worse than Jonathan; Tinubu better than Buhari.
Largest pairwise contrast. Muhammadu Buhari sat -3.27 % from the trend relative to Bola Ahmed Tinubu, across the declared spans.
Headline inflation (y/y)
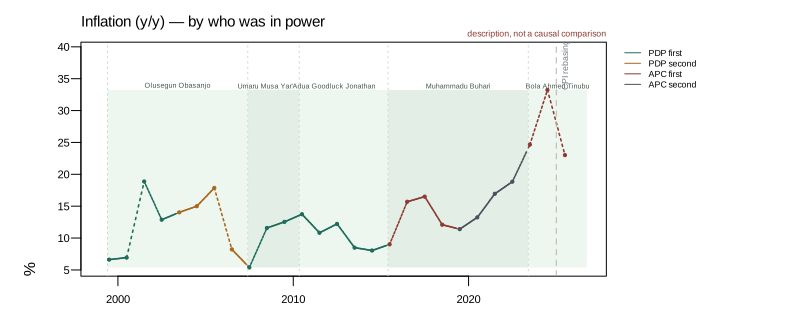
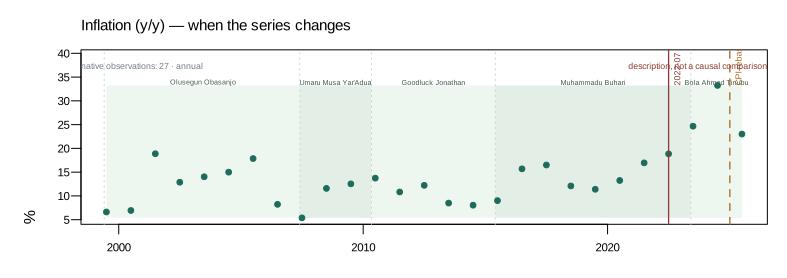
Inflation (y/y): 334 months of which 27 observed. Grouped by who was in power (no state grouping is declared for this outcome). Native frequency annual; flagged (1999-07 to 2025-07).
What each group's average is
the first PDP term(PDP_first) the first PDP term: 144 months across 3 administrations; 12 with an observation; mean 11.1 a month (10.7 over observed months only).
the second PDP term(PDP_second) the second PDP term: 48 months across 1 administration; 4 with an observation; mean 13.0 a month (13.8 over observed months only).
the first APC term(APC_first) the first APC term: 89 months across 2 administrations; 7 with an observation; mean 18.7 a month (19.2 over observed months only).
the second APC term(APC_second) the second APC term: 48 months across 1 administration; 4 with an observation; mean 16.4 a month (15.1 over observed months only).
No state grouping is declared for this outcome.
When the series changes
2022-07: Inflation (y/y) changes level around 2022-07.
2025-01: The series is measured differently from 2025-01 (CPI rebasing (2024 base year)).
Bai-Perron mean model, 0-1 breaks, BIC over 2m+1 parameters, 1 selected
Each president against the trend
The trend is fitted without ever seeing who was in power. Figures are percentages.
Tenure
Party
Years
Comparison with the president before
Change
Olusegun Obasanjo
PDP
8
no earlier span
start
Umaru Musa Yar'Adua
PDP
3
vs Obasanjo: -2.55 [-2.93 … -2.20]
change, good
Goodluck Jonathan
PDP
5
vs Yar'Adua: +0.88 [+0.40 … +1.19]
change, bad
Muhammadu Buhari
APC
8
vs Jonathan: -0.90 [-1.18 … -0.65]
change, good
Bola Ahmed Tinubu
APC
3
vs Buhari: +5.55 [+2.93 … +8.09]
change, bad
Furthest from the trend: Bola Ahmed Tinubu, averaging 3.69 above it. Across all settings, Yar'Adua better than Obasanjo; Jonathan worse than Yar'Adua; Buhari better than Jonathan; Tinubu worse than Buhari.
Largest pairwise contrast. Muhammadu Buhari sat -5.55 % from the trend relative to Bola Ahmed Tinubu, across the declared spans.
Unemployment rate
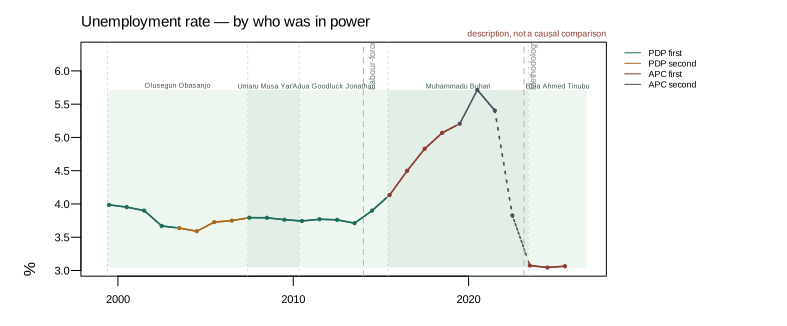
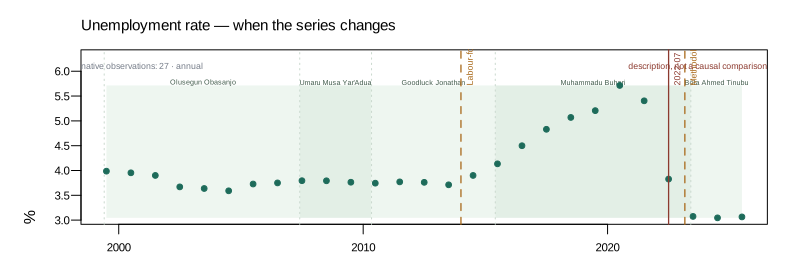
Unemployment rate: 334 months of which 27 observed. Grouped by who was in power (no state grouping is declared for this outcome). Native frequency annual; ok (1999-07 to 2025-07).
What each group's average is
the first PDP term(PDP_first) the first PDP term: 144 months across 3 administrations; 12 with an observation; mean 3.8 a month.
the second PDP term(PDP_second) the second PDP term: 48 months across 1 administration; 4 with an observation; mean 3.7 a month.
the first APC term(APC_first) the first APC term: 89 months across 2 administrations; 7 with an observation; mean 4.1 a month (4.0 over observed months only).
the second APC term(APC_second) the second APC term: 48 months across 1 administration; 4 with an observation; mean 4.8 a month (5.0 over observed months only).
No state grouping is declared for this outcome.
When the series changes
2014-01: The series is measured differently from 2014-01 (Labour-force methodology change).
2022-07: Unemployment rate changes level around 2022-07.
2023-03: The series is measured differently from 2023-03 (Methodology revision).
Bai-Perron mean model, 0-1 breaks, BIC over 2m+1 parameters, 1 selected
Each president against the trend
The trend is fitted without ever seeing who was in power. Figures are percentages.
Tenure
Party
Years
Comparison with the president before
Change
Olusegun Obasanjo
PDP
8
no earlier span
start
Umaru Musa Yar'Adua
PDP
3
vs Obasanjo: -0.04 [-0.19 … +0.05]
no change, neutral
Goodluck Jonathan
PDP
5
vs Yar'Adua: -0.20 [-0.27 … -0.15]
change, good
Muhammadu Buhari
APC
8
vs Jonathan: +0.75 [+0.44 … +0.98]
change, bad
Bola Ahmed Tinubu
APC
3
vs Buhari: -1.31 [-1.78 … -0.68]
change, good
Furthest from the trend: Bola Ahmed Tinubu, averaging 0.79 below it. Across all settings, Jonathan better than Yar'Adua; Buhari worse than Jonathan; Tinubu better than Buhari. The move from Obasanjo to Yar'Adua is not consistent across settings, so it is neutral.
Largest pairwise contrast. Muhammadu Buhari sat +1.31 % from the trend relative to Bola Ahmed Tinubu, across the declared spans.
Photograph credits
Helene C. Stikkel - public domain (courtesy credit; no attribution required)
World Economic Forum - CC BY-SA 2.0, cropped and resized
World Economic Forum - CC BY-SA 2.0, cropped and resized
Bayo Omoboriowo - CC BY-SA 4.0, cropped and resized