

Photo credits
- Moneta Sleet Jr. - public domain, Saint Louis Art Museum
- Heinrich-Boell-Stiftung - CC BY-SA 2.0
- Kaizenify - CC BY-SA 4.0
Causal Presidents · the design-level results
The design-level results
The three figures that decided the verdicts below. Each is drawn by R from the same rows this page counts.
The figure is the artifact. If it were one re-fit behind the table, its recorded byte count would no longer match the file.
What was published
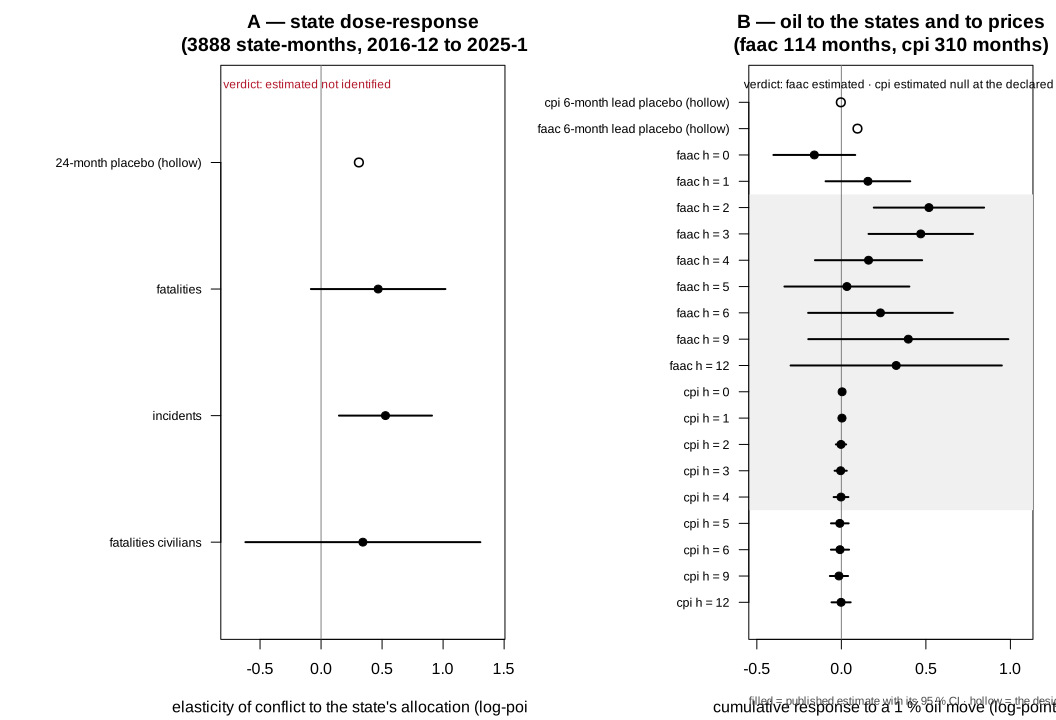
State dose-response DiD
Verdict estimated_not_identified
the lead-shift p-value is 0.167: 10 of 60 mis-timed doses return an estimate at least as large as the estimate itself
- Reported security fatalities: +0.4678, 95 % interval [-0.0833 – 1.0189], 3,888 observations
- Reported security incidents: +0.5278, 95 % interval [0.1467 – 0.9088], 3,888 observations
- civilian fatalities (a UCDP item counted inside the security outcome): +0.3427, 95 % interval [-0.6198 – 1.3052], 3,564 observations
The checks that decided it
- The mis-timed dose, shifted 24 months, returns +0.3101.
- The lead-shift check covers 60 shifted alignments and returns p = 0.1667.
National VECM / ARDL time series
Verdict estimated
- the national money that reached the states: +0.5181, 95 % interval [0.1919 – 0.8443], 111 observations
What the grid found
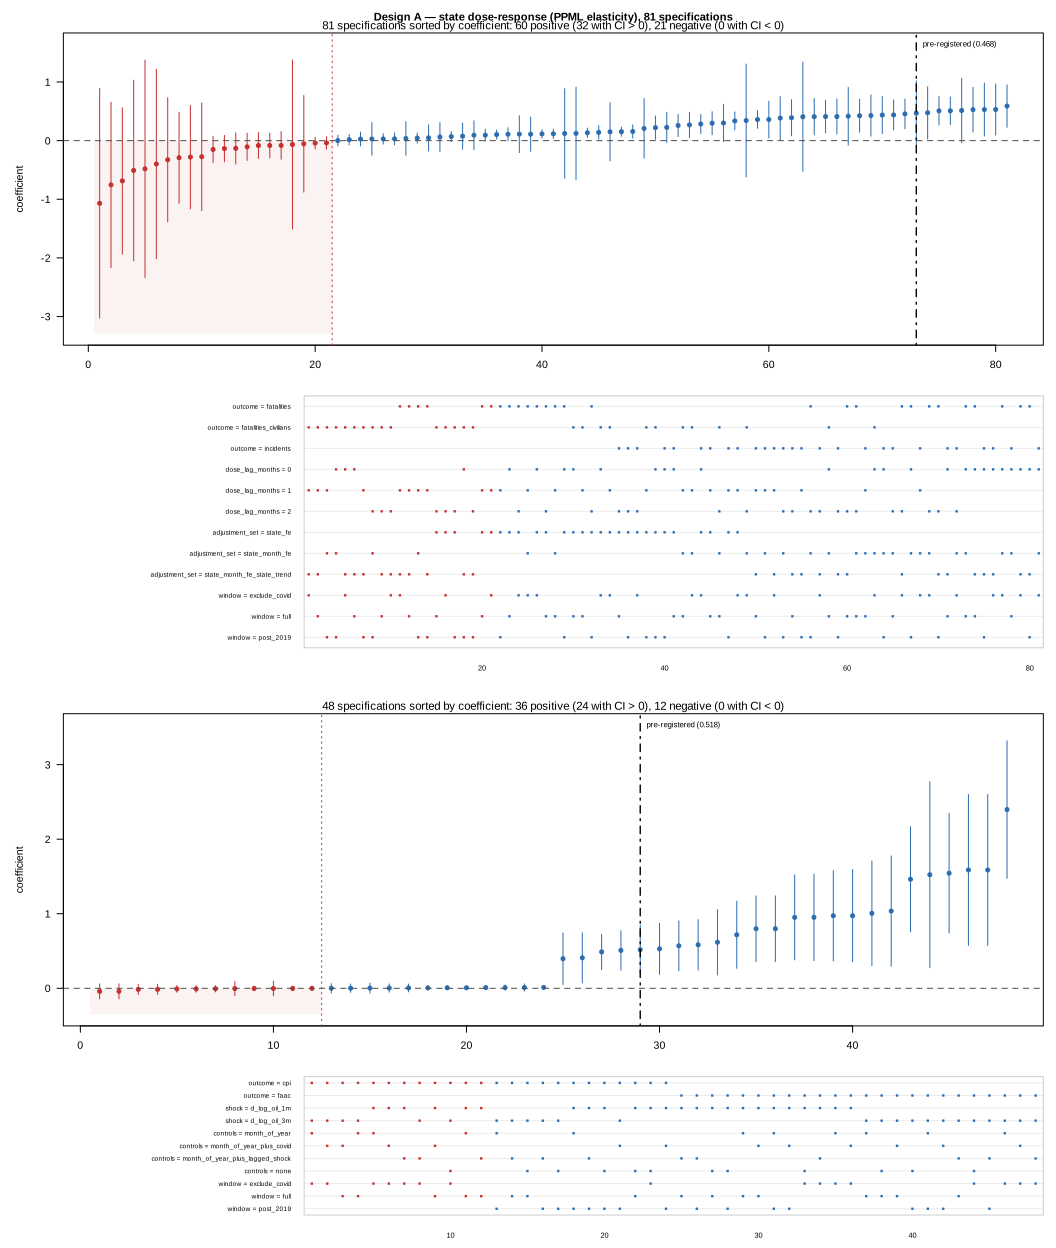
60 of 81 specifications are positive, 21 negative, and 2 sit inside the near-zero band.
- outcome = fatalities civilians: 15 of 27 specifications point the other way
36 of 48 specifications are positive, 12 negative, and 22 sit inside the near-zero band.
Across the grid the coefficient runs from 0.3968 to 2.3976.
The in-time placebo returns p = 0.0625 over 48 shifted alignments.
The sign of Design B disagrees with the preferred one in 12 of 48 grid specifications exclude zero, but the in-time placebo does not clear 0.05: 3 of 48 shifted alignments return an estimate at least as large as the true one (p = 0.0625). The sign is the robust claim here; the timing is the weaker one, and it is what the placebo tests.
The synthetic counterfactual
Synthetic control (cross-country)
Verdict estimated_not_identified
9 outcomes, 31 windows estimated against a synthetic Nigeria built from 99 donor countries; 14 windows refused by the declared rule, and 0 survived their placebos. Each outcome is its own fit in its own unit, so a gap of 2 in one is not twice a gap of 1 in another. The bracketed figure is the same problem under a ridge refit: where the two disagree in sign, the estimate belongs to the solver rather than to the data.
One outcome was fitted a second way in 2026, with an estimator that does not depend on the 99-donor simplex: under-5 mortality. It refused as well, every window sitting inside the range that treating a random country produces, so the refusal does not rest on the ridge check alone. That second fit is reported in the project's documentation, not on this page, and no number from it is published.
Under-5 mortality rate (per 1,000 live births)
- 2007–2009: gap +2.1076 (ridge -2.5956), placebo p = 0.50, estimated not identified
- 2010–2014: gap -11.5585 (ridge -0.3709), placebo p = 0.32, estimated not identified
- 2015–2022: gap +8.5882 (ridge +9.3757), placebo p = 0.17, estimated not identified
- 2023–2024: gap +18.5340 (ridge +18.5023), placebo p = 0.33, estimated not identified
Maternal mortality ratio (per 100,000 births)
- 2007–2009: gap +4.2821 (ridge -21.6101), placebo p = 0.62, estimated not identified
- 2010–2014: gap +135.8225 (ridge +140.6885), placebo p = 0.14, estimated not identified
- 2015–2022: gap +171.5283 (ridge +171.5283), placebo p = 0.54, estimated not identified
Penta3 immunisation coverage (% surviving infants)
- 2007–2009: gap +10.8737 (ridge +10.9032), placebo p = 0.65, estimated not identified
- 2010–2014: gap -12.5678 (ridge -12.9507), placebo p = 0.59, estimated not identified
- 2015–2022: gap +0.6855 (ridge +0.7196), placebo p = 0.98, estimated not identified
- 2023–2024: gap -2.1134 (ridge -2.0879), placebo p = 0.96, estimated not identified
Skilled birth attendance (% of births)
Every declared window was refused for this outcome: Nigeria's series cannot fill a window of this design's declared length. The card carries the reason.
Reported security fatalities (count)
- 2007–2009: gap +44.8334 (ridge +44.7021), placebo p = 0.95, estimated not identified
- 2010–2014: gap +3349.0861 (ridge +3349.5704), placebo p = 0.57, estimated not identified
- 2015–2022: gap -6728.3706 (ridge -6631.7959), placebo p = 0.46, estimated not identified
- 2023–2024: gap +370.1873 (ridge +428.5653), placebo p = 0.83, estimated not identified
Reported security incidents (count)
- 2007–2009: gap +8.3985 (ridge +6.9009), placebo p = 0.72, estimated not identified
- 2010–2014: gap +287.6503 (ridge +117.8263), placebo p = 0.48, estimated not identified
- 2015–2022: gap -18.5404 (ridge +96.2382), placebo p = 0.41, estimated not identified
- 2023–2024: gap +100.9130 (ridge +72.7683), placebo p = 0.43, estimated not identified
Real GDP growth (y/y) (%)
- 2007–2009: gap +2.4209 (ridge +2.6218), placebo p = 0.45, estimated not identified
- 2010–2014: gap +5.3523 (ridge +5.2541), placebo p = 0.48, estimated not identified
- 2015–2022: gap -3.1416 (ridge -3.1512), placebo p = 0.59, estimated not identified
- 2023–2024: gap +3.1058 (ridge +3.1041), placebo p = 0.25, estimated not identified
Headline inflation (y/y) (%)
- 2007–2009: gap -2.3675 (ridge -1.7799), placebo p = 0.77, estimated not identified
- 2010–2014: gap +2.9518 (ridge +3.6543), placebo p = 0.77, estimated not identified
- 2015–2022: gap +0.3991 (ridge +0.5897), placebo p = 0.68, estimated not identified
- 2023–2024: gap +5.3059 (ridge +5.6159), placebo p = 0.21, estimated not identified
Unemployment rate (%)
- 2007–2009: gap +0.1277 (ridge +0.1499), placebo p = 0.31, estimated not identified
- 2010–2014: gap +0.0775 (ridge +0.0180), placebo p = 0.32, estimated not identified
- 2015–2022: gap +1.3683 (ridge +0.7298), placebo p = 0.16, estimated not identified
- 2023–2024: gap -1.0480 (ridge -0.7311), placebo p = 0.08, estimated not identified
A synthetic control has no sampling distribution, so there is no interval here and none of these gaps is a card number. An outcome whose every window was refused is listed with the reason instead.
Did anything move at a transition?
Four transitions, two outcomes, and a placebo drawn from every eligible month. The rows below name the month, not the person: a shift at a transition is not a verdict on a presidency, and this page will not print one.
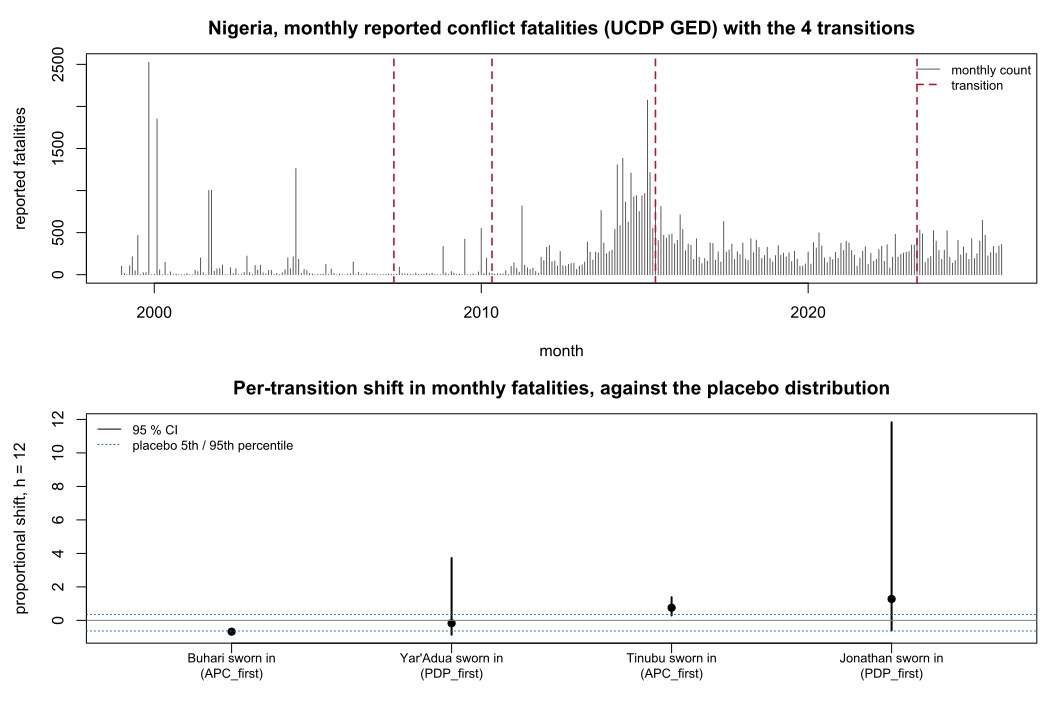
- 2007-05 · Reported security fatalities · the check cannot be run · placebo p = 0.6102
- 2007-05 · Reported security incidents · the check cannot be run · placebo p = 0.1864
- 2010-05 · Reported security fatalities · a shift, but the pre-trend check fails · placebo p = 0.0169
- 2010-05 · Reported security incidents · a shift survives both checks · placebo p = 0.0169
- 2015-05 · Reported security fatalities · a shift, but the pre-trend check fails · placebo p = 0.0169
- 2015-05 · Reported security incidents · no shift beyond the placebo · placebo p = 0.0847
- 2023-05 · Reported security fatalities · a shift survives both checks · placebo p = 0.0339
- 2023-05 · Reported security incidents · a shift, but the pre-trend check fails · placebo p = 0.1695
The rule the verdicts were read against
Per event, per outcome, at the h=12 focus horizon in the declared baseline variant: shift_detected when the per-event placebo p-value is <= 0.05 and the pre-trend placebo shift is smaller in magnitude than the post-window shift; not_interpretable_pre_trend when the pre-trend shift is at least as large; check_not_available when the pre-trend placebo cannot be run at all (it needs 120 months before the transition and the series is shorter behind the earliest event) — a missing check is reported as missing, not as a null; no_shift_detected otherwise. The family-wise p-value is published for every event regardless of its verdict, because four events read together are the largest of four whatever the rule says.
What this does not claim
- A causal effect of a tenure, a party or a president on conflict. The design is a within-series timing comparison and nothing here identifies a counterfactual.
- That conflict is measured without reporting bias. UCDP GED is a reported-events archive; the divergence check is a guard, not a fix.
- A pooled 'tenure effect'. Four event-level estimates are published; there is no average.
- Anything about the annual outcome domains. They have no monthly series, which is the same wall Stage 5 hit.
Registry vintage 2026-11-01