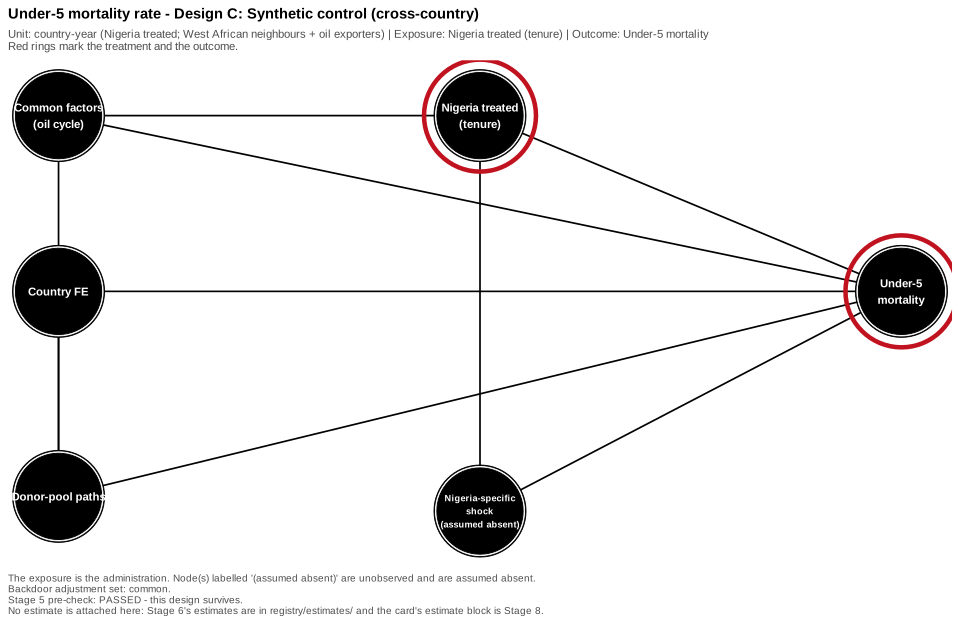
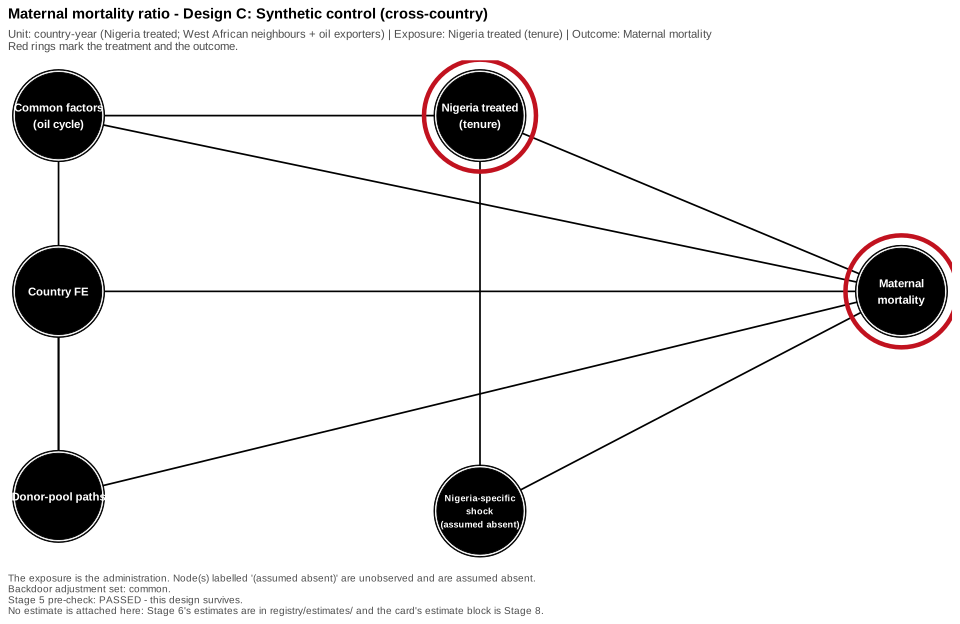
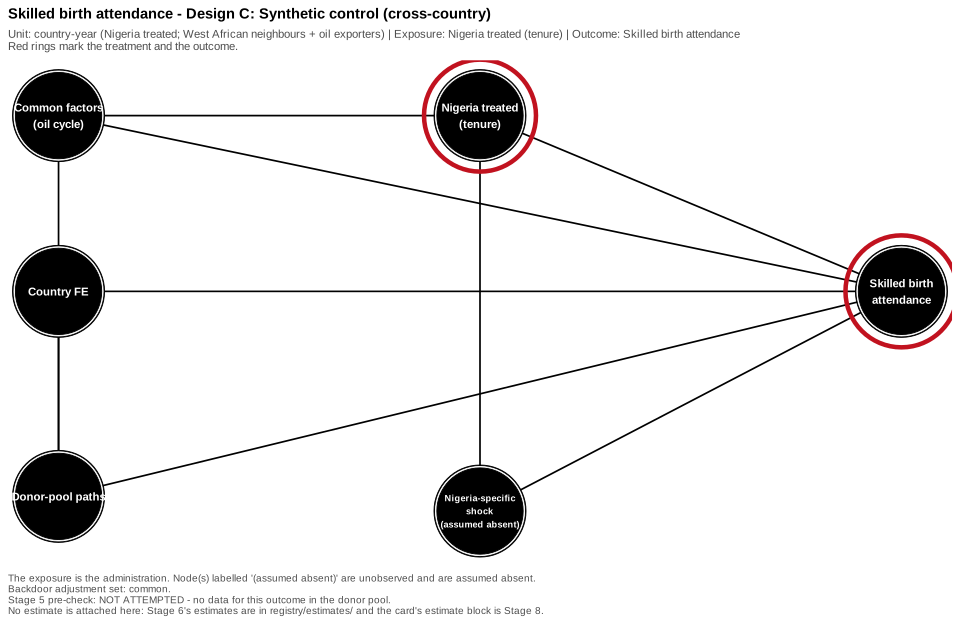
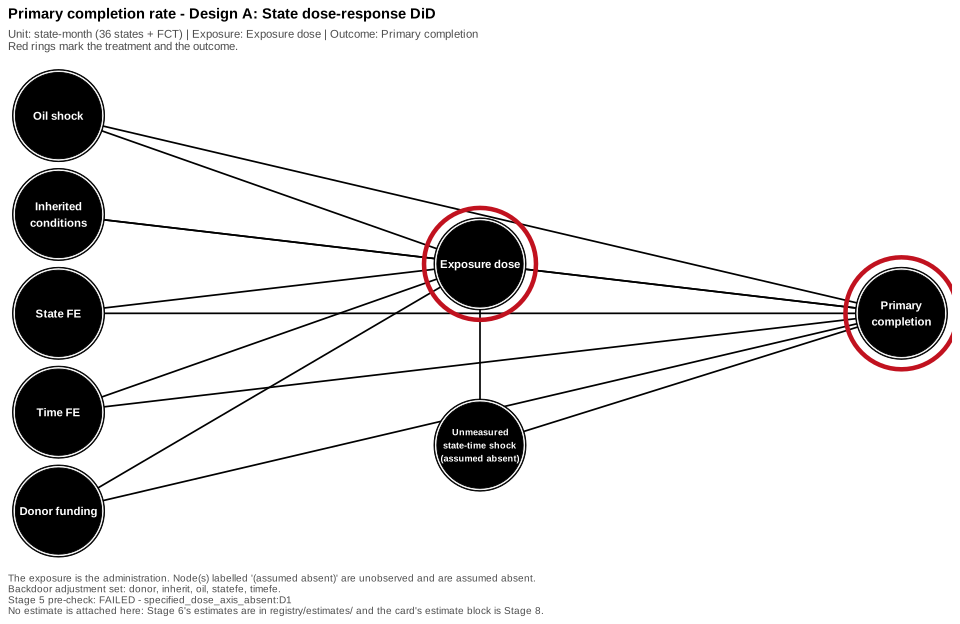
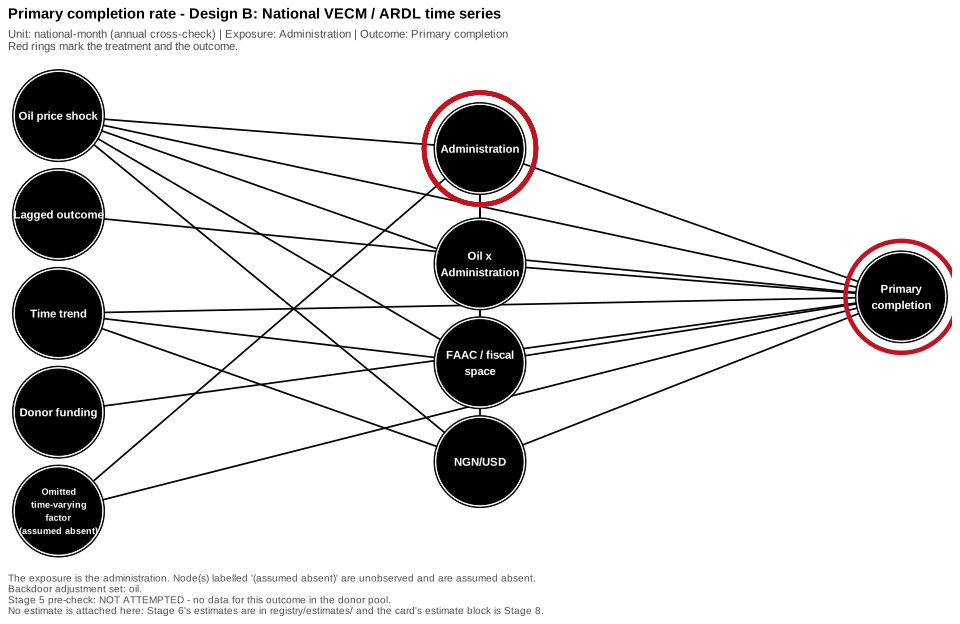
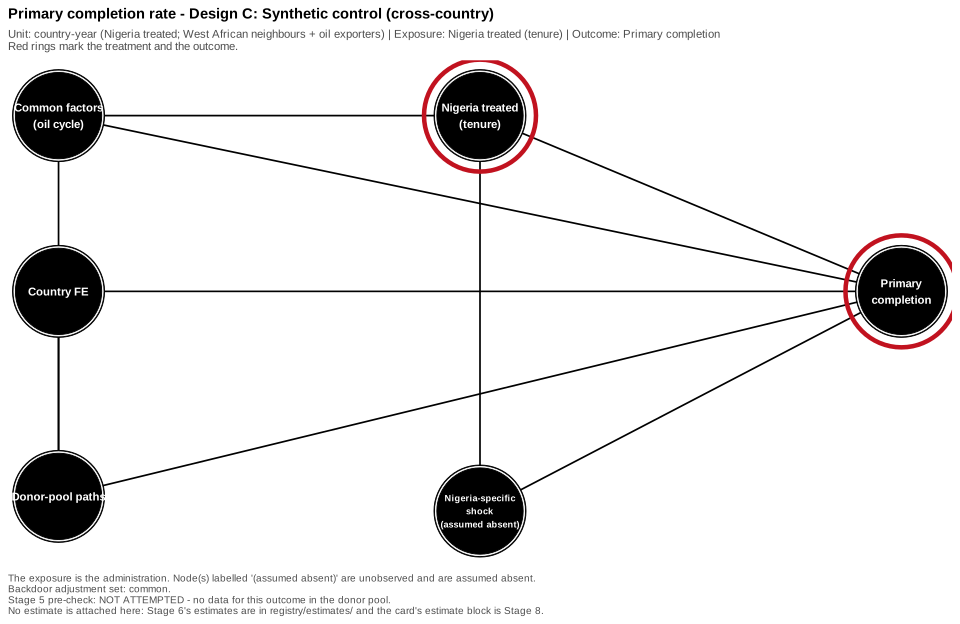
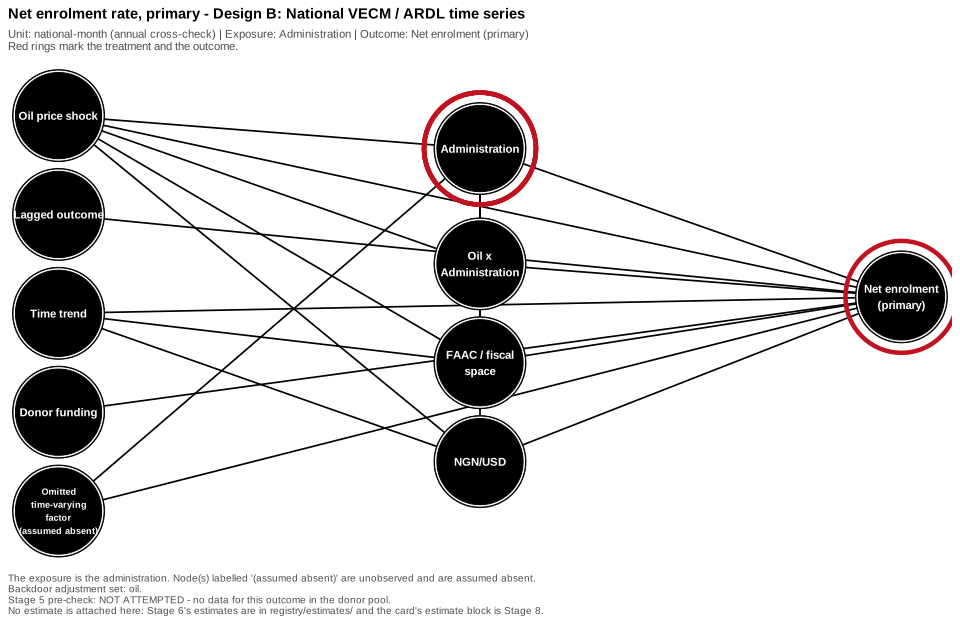
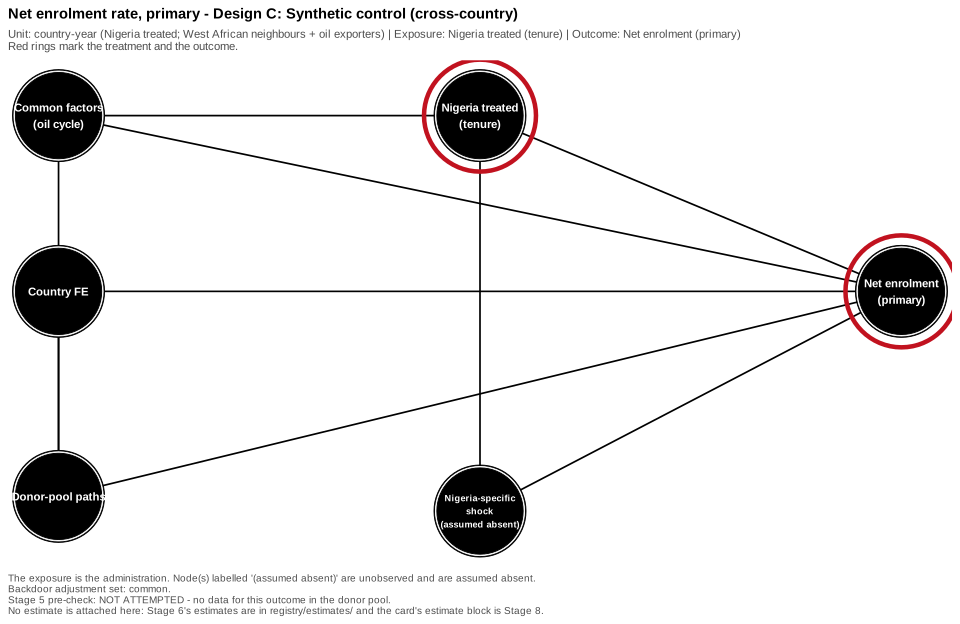
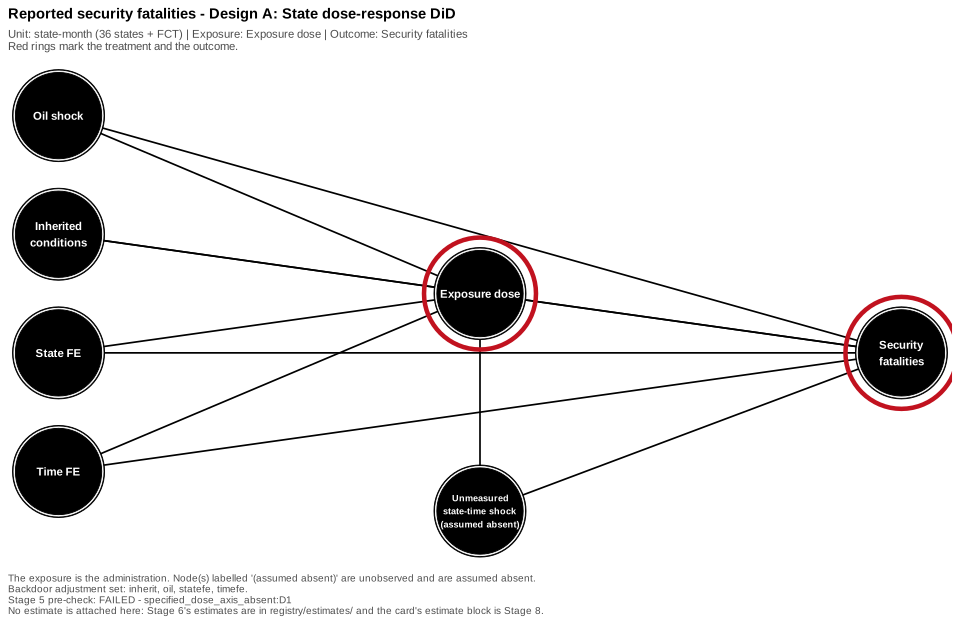
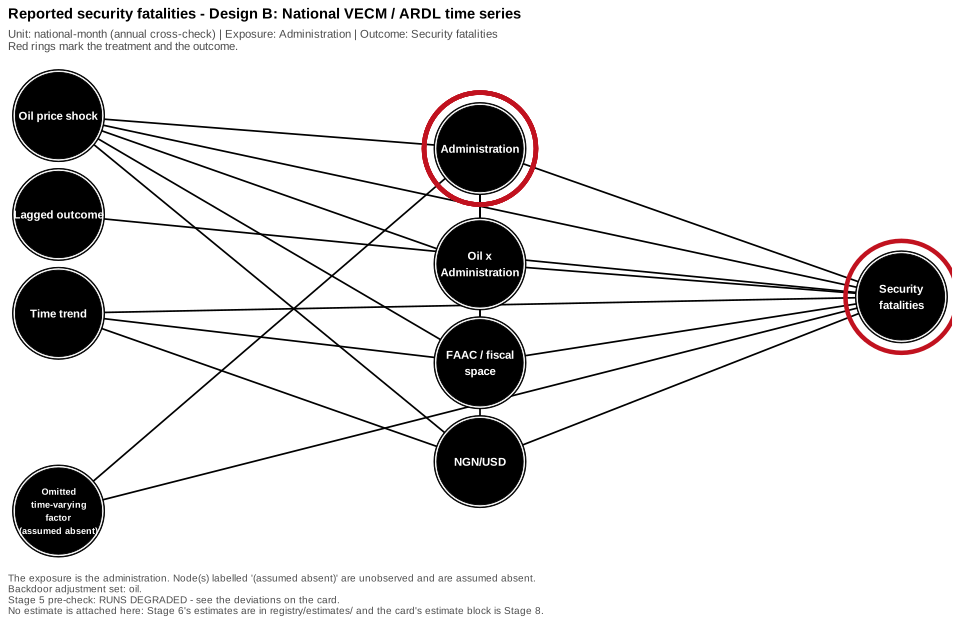
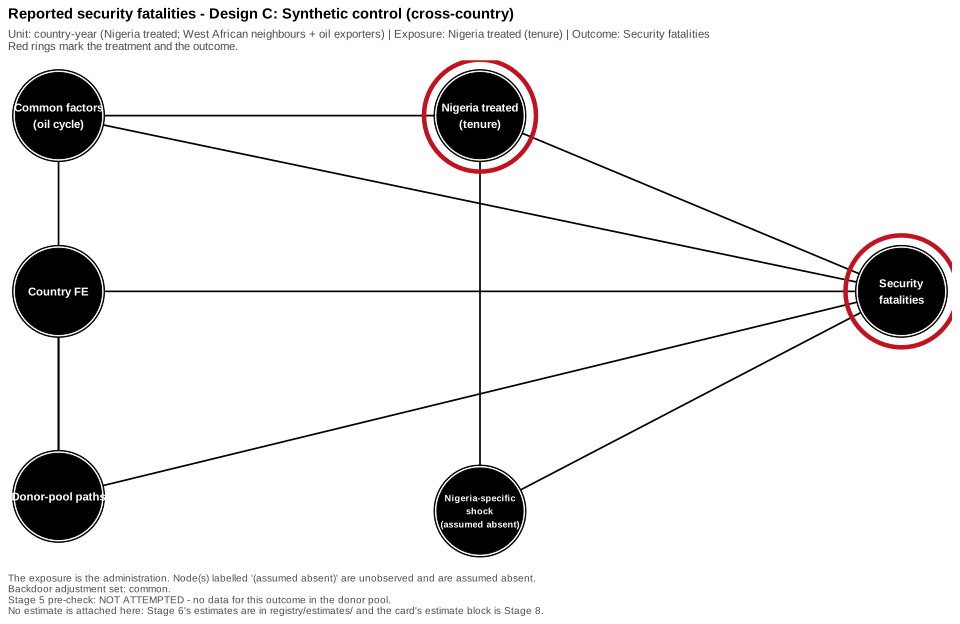
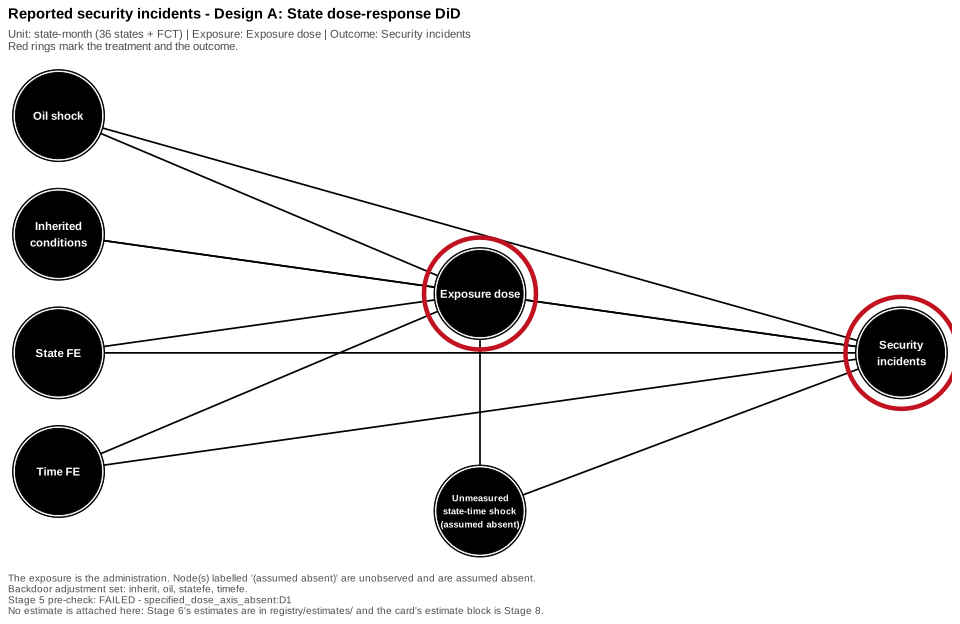
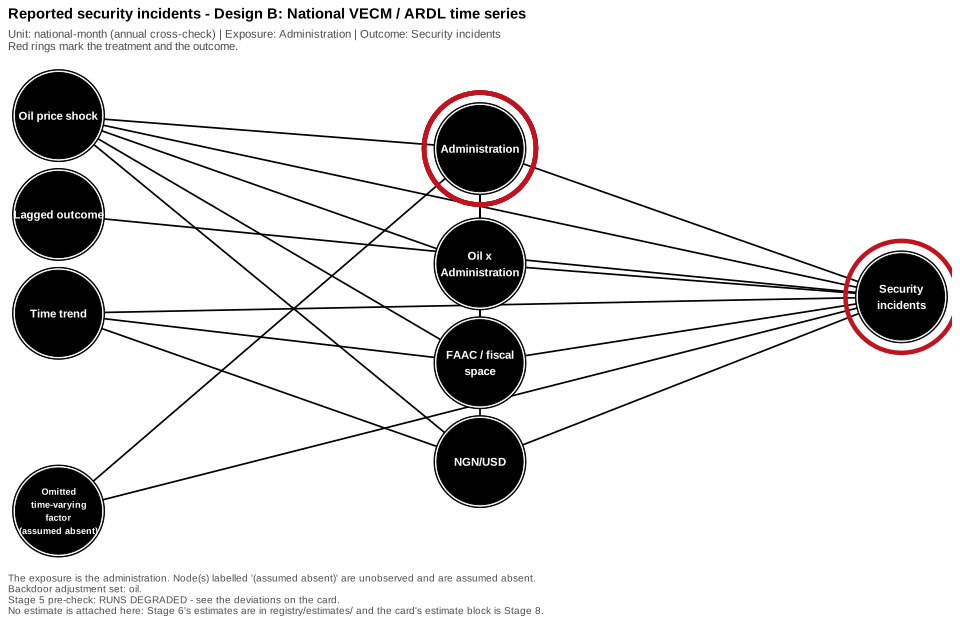
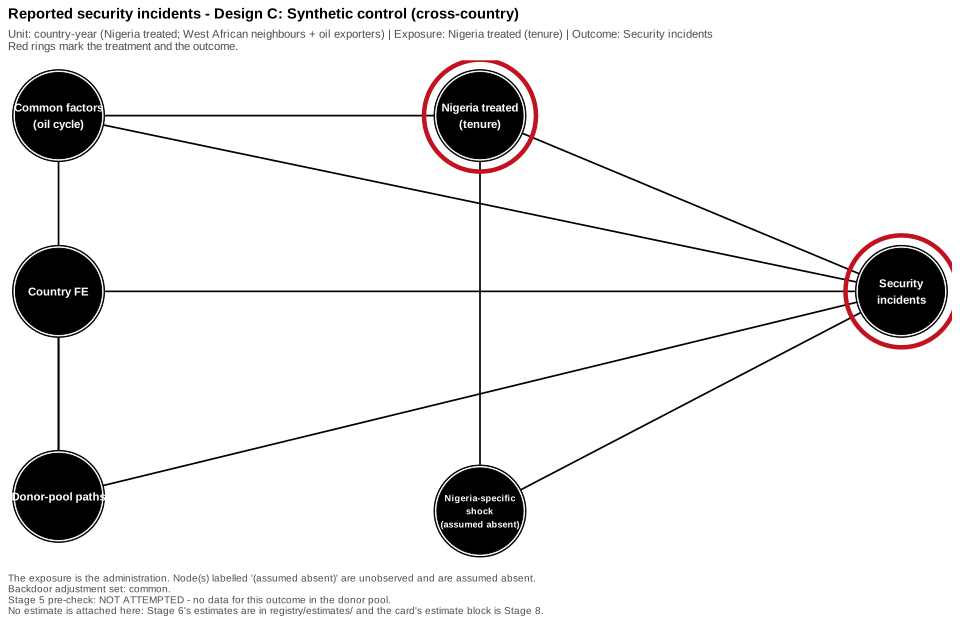
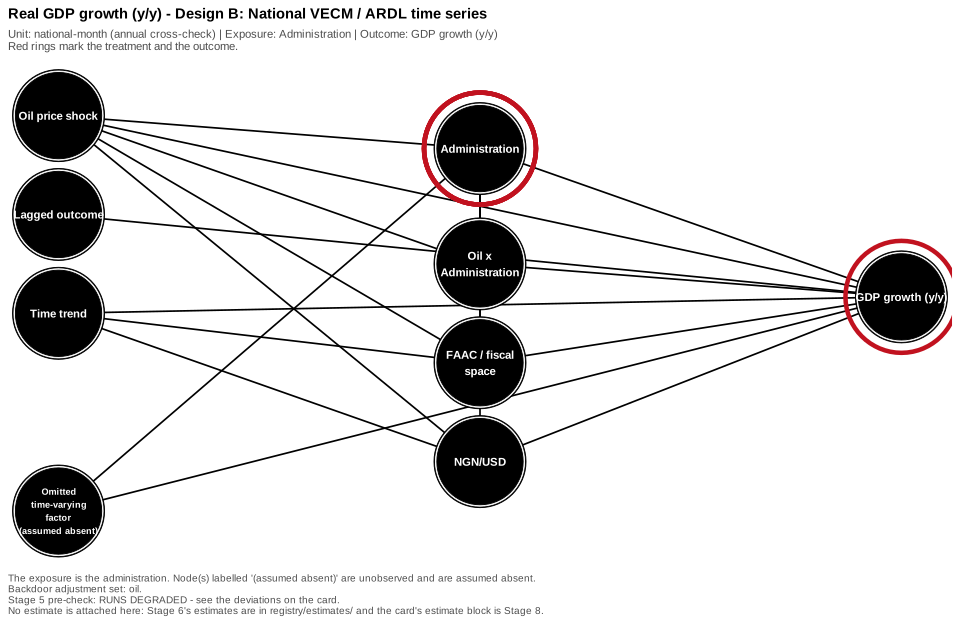
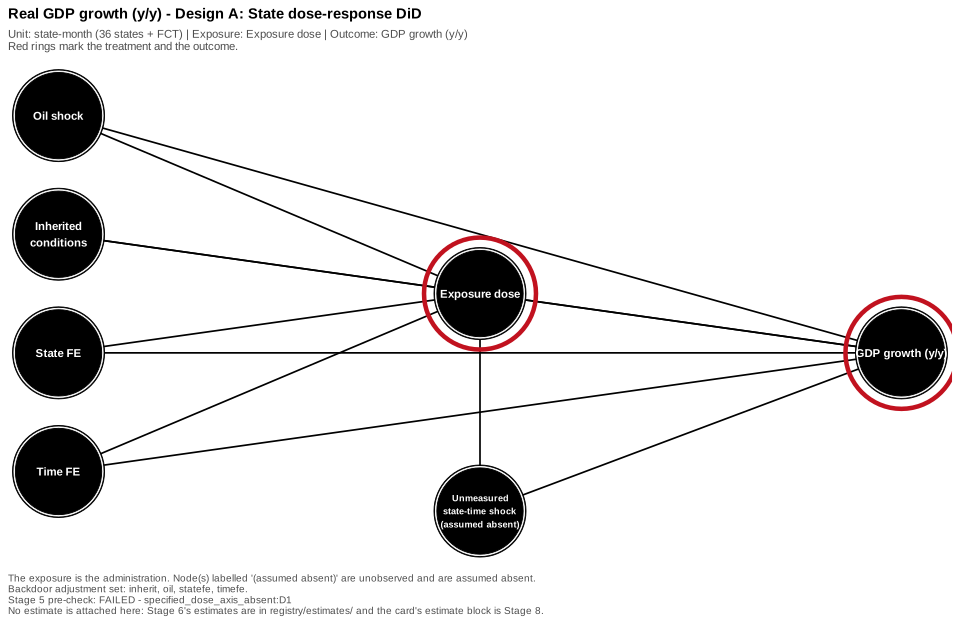
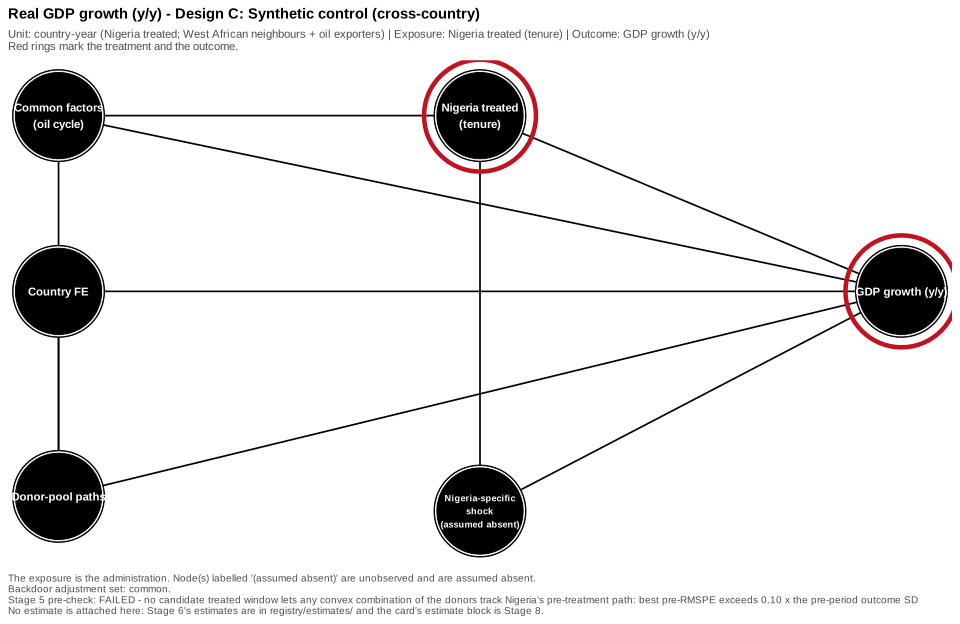
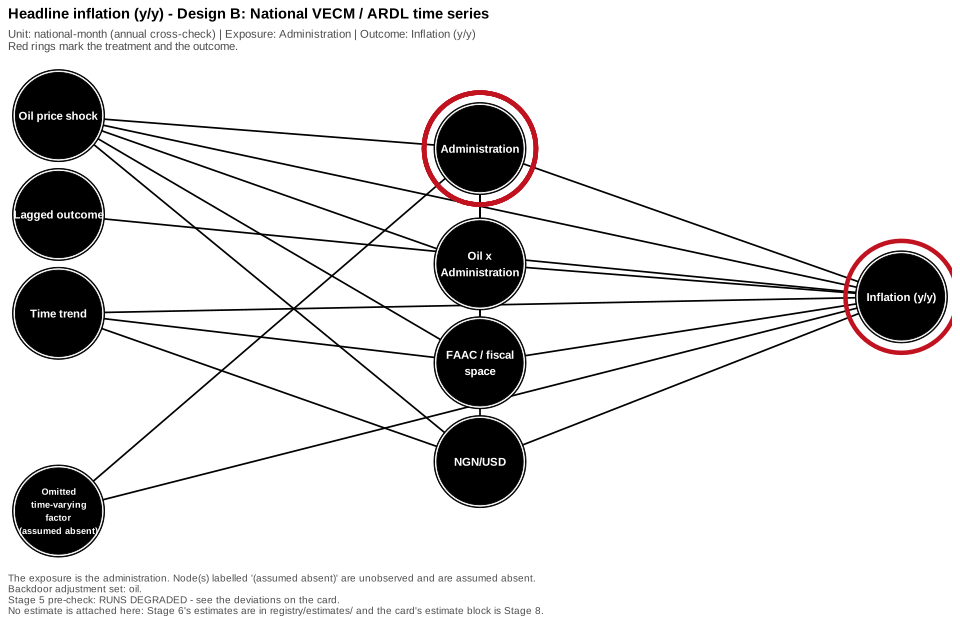
This is the graph the chosen comparison rests on. If the assumption is false, the number below it is not an effect.
The unobserved node is drawn, not omitted; adjustment sets are computed, never hand-listed.
Under-5 mortality rate
C · Synthetic control (cross-country)
The assumption
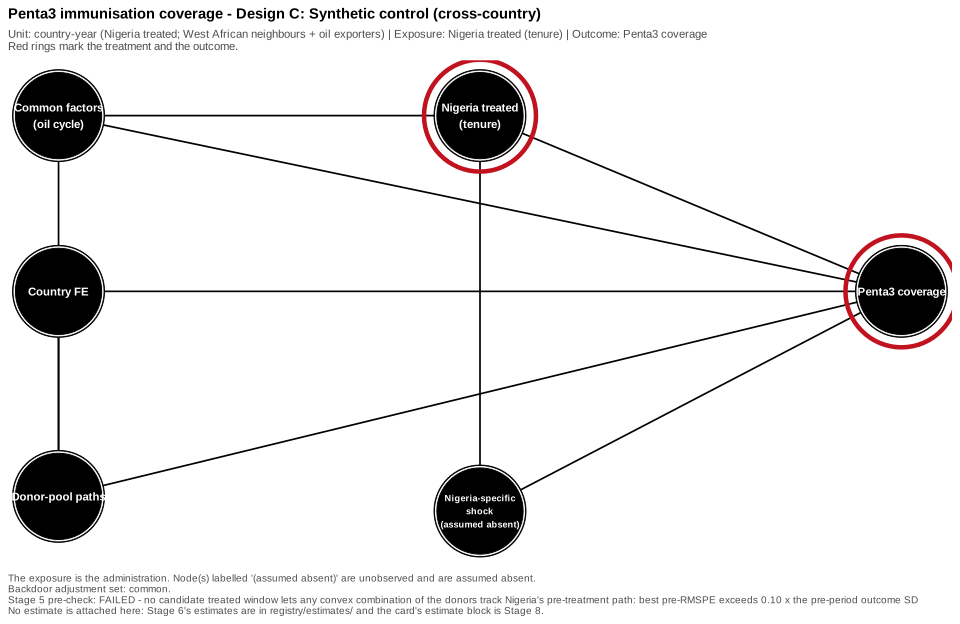
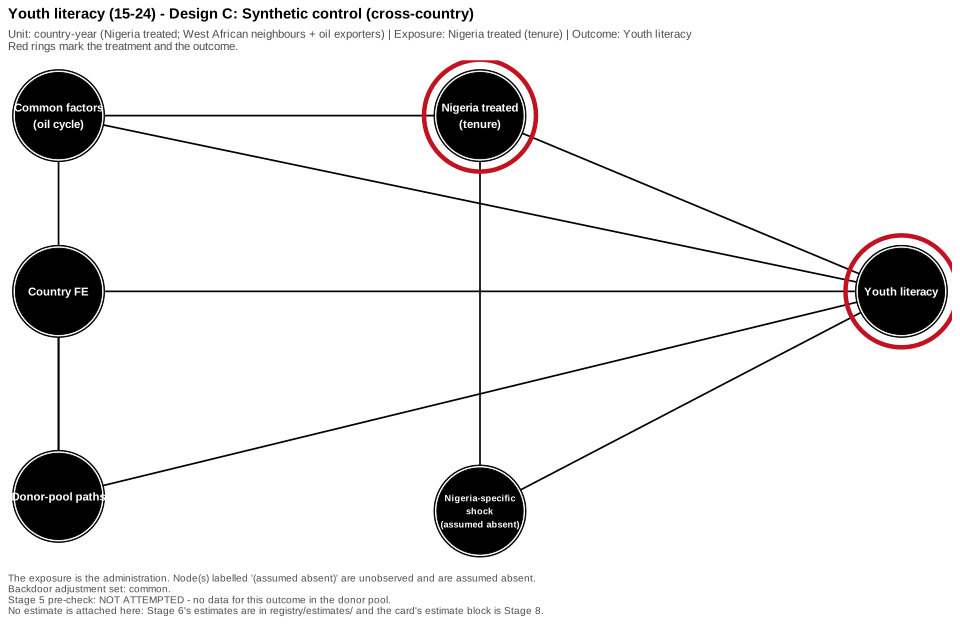
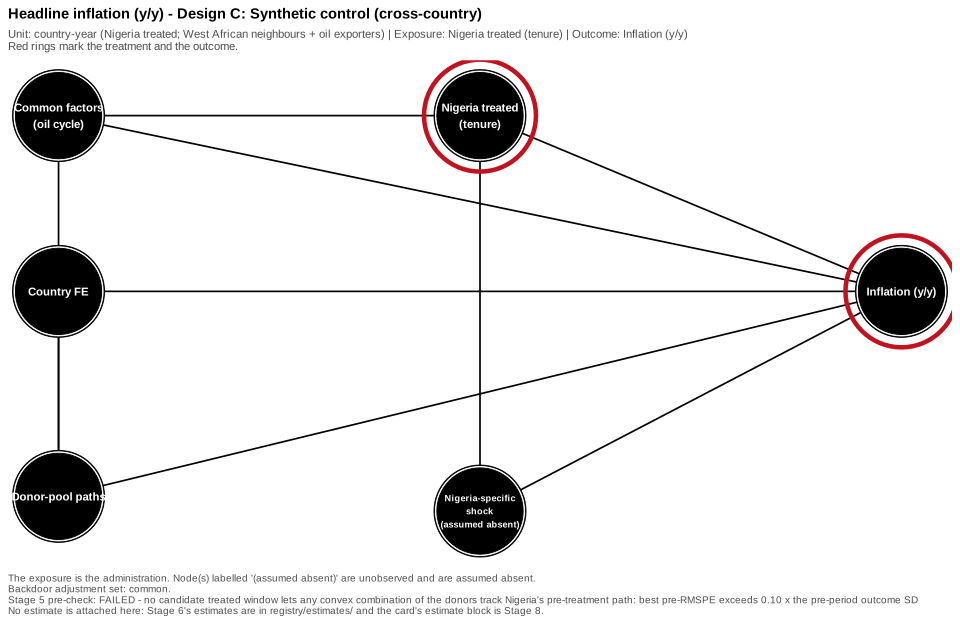
The synthetic control reproduces Nigeria's outcome path absent treatment: donor-weighted common factors (above all the global oil and commodity cycle) stand in for Nigeria's counterfactual, and no Nigeria-specific shock coincides with the treatment (the unobserved node is absent).
Adjustment set (what the comparison holds fixed)
Common factors (global oil / commodity cycle) (common)
Assumed absent (the thing that must not exist)
Nigeria-specific shock coinciding with treatment (u_ng)
What this cannot rule out (what could still spoil it)
Five treated tenures is a small treated set — the donor pool cannot always buy a credible counterfactual.
Sparse pre-treatment fit weakens the comparison, and the card must say so rather than ship the gap.
Contemporaneous global shocks affect donors differently than Nigeria even when the oil channel is shared.
The other graphs for this outcomethe check it needed failed
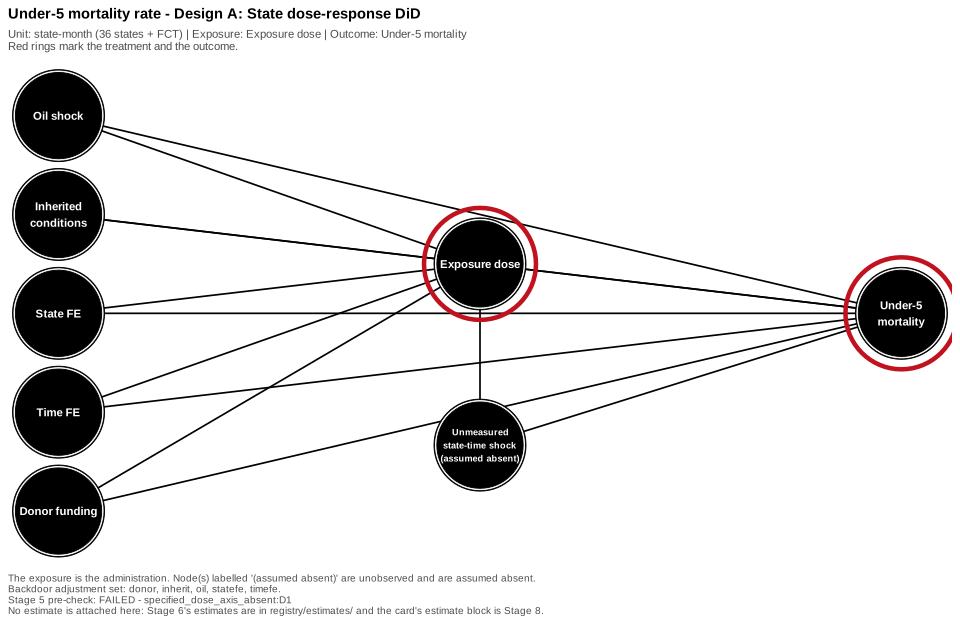
A · State dose-response DiD
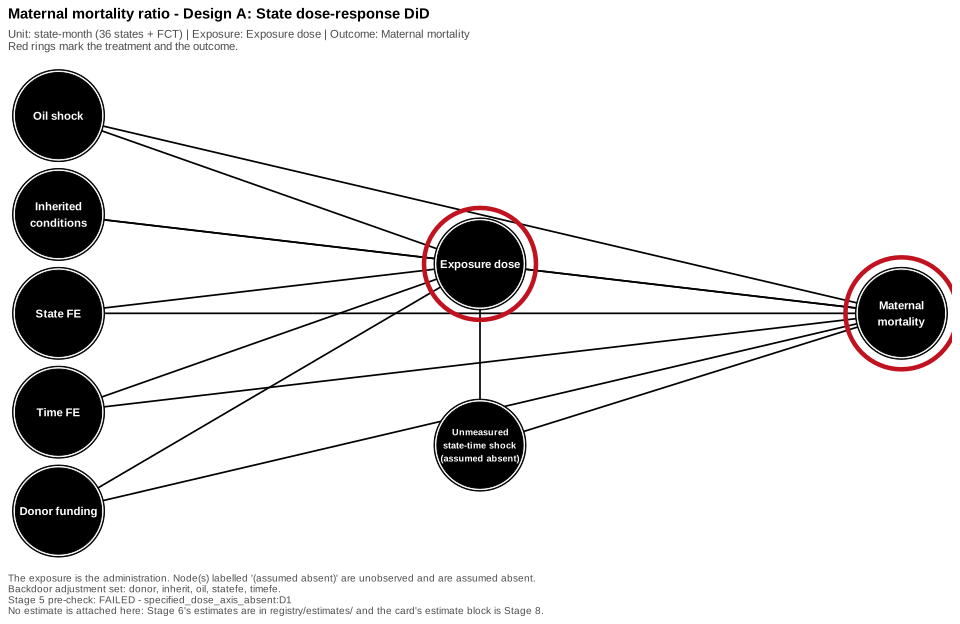
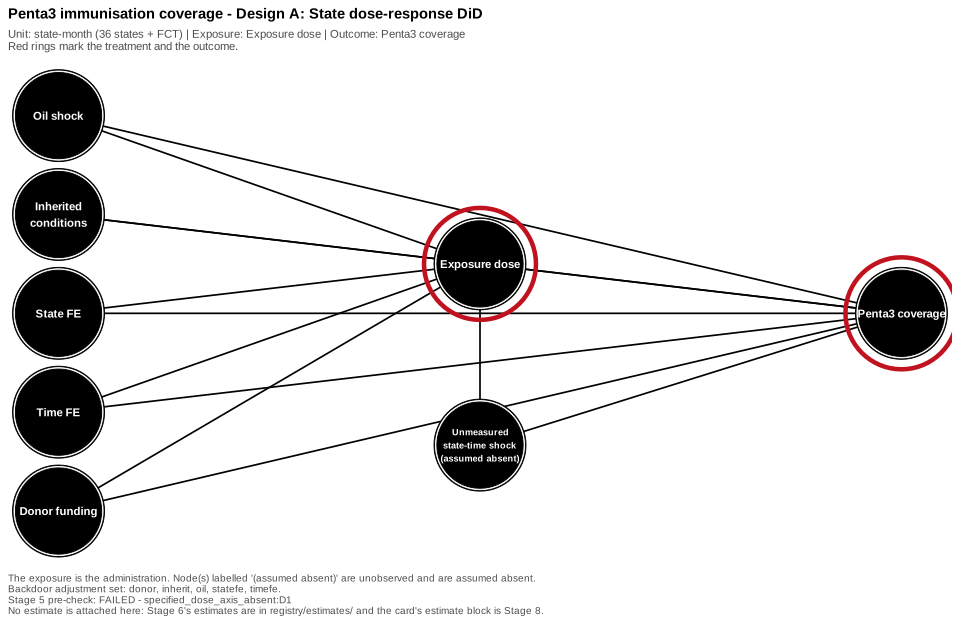
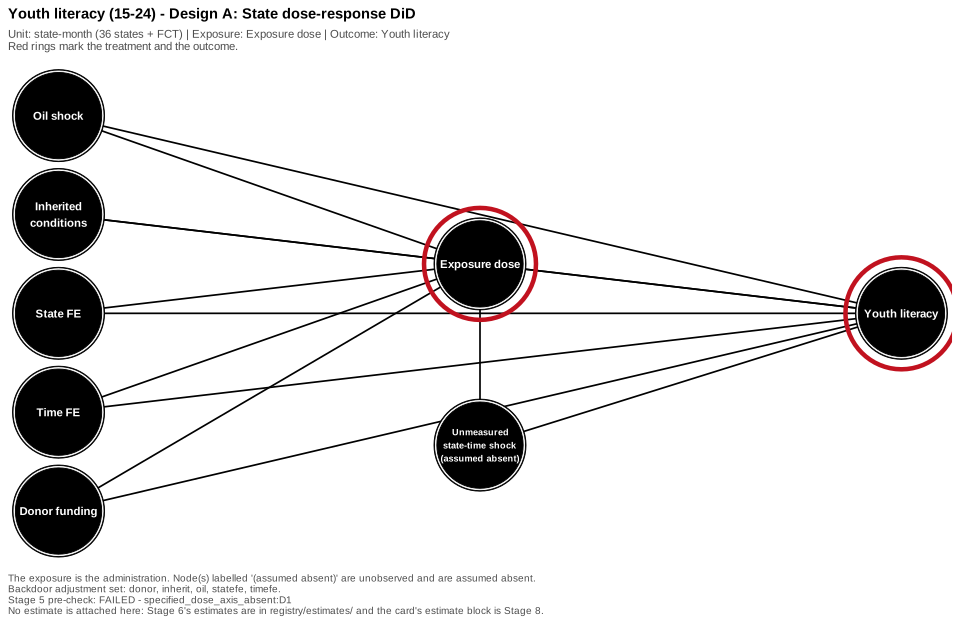
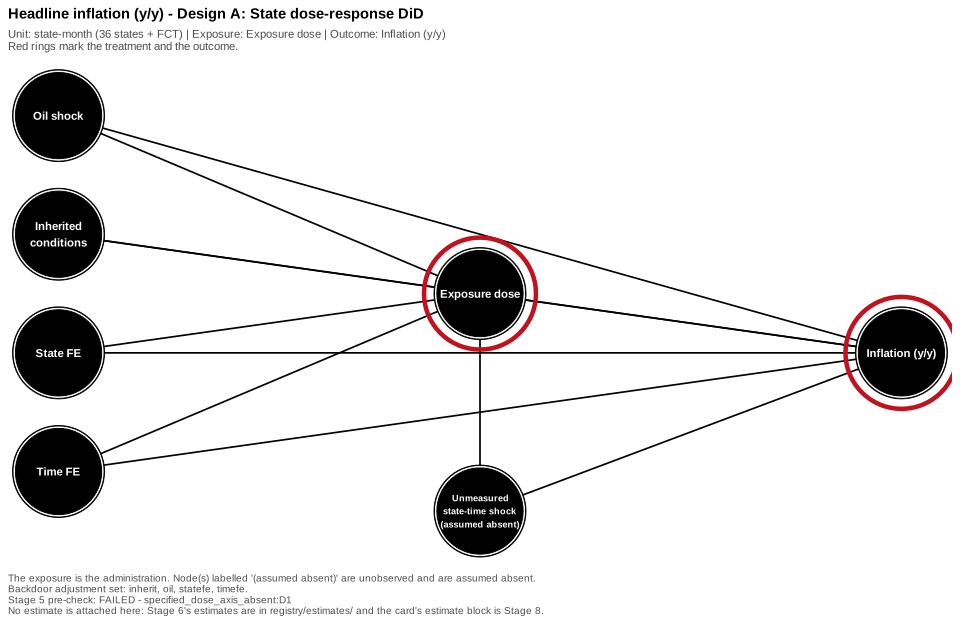
Parallel trends: absent the policy shift, states with different exposure intensities would have followed parallel outcome paths. Formally, no unmeasured state-by-time confounder affects both the dose and the outcome (the unobserved node is absent).
usable with a warning
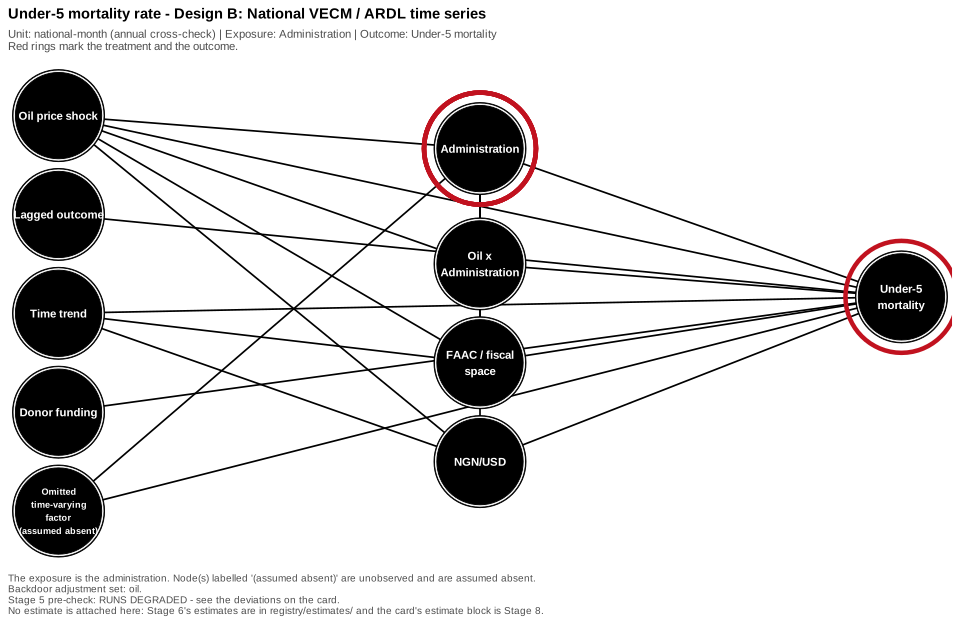
B · National VECM / ARDL time series
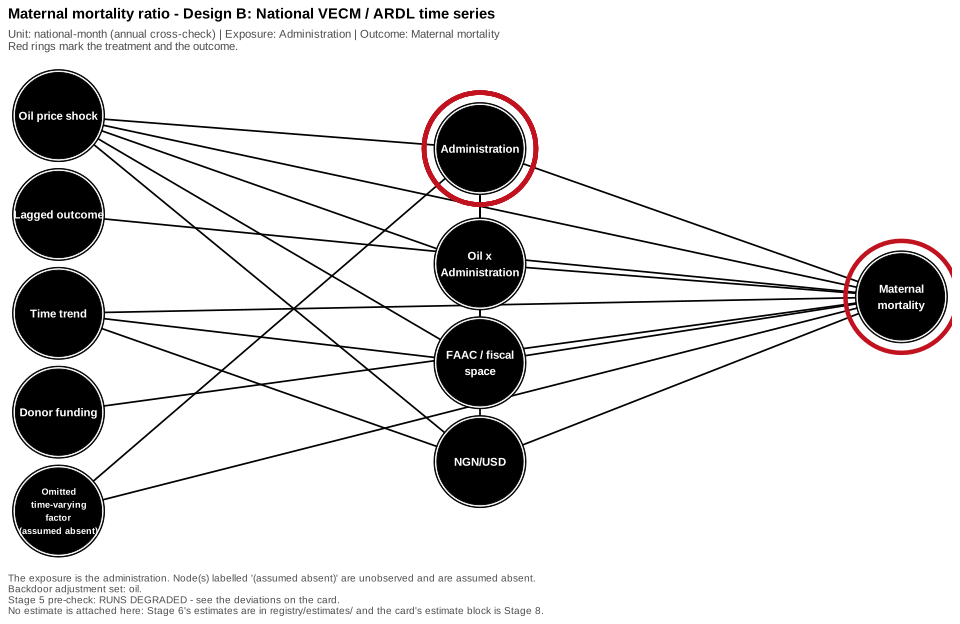
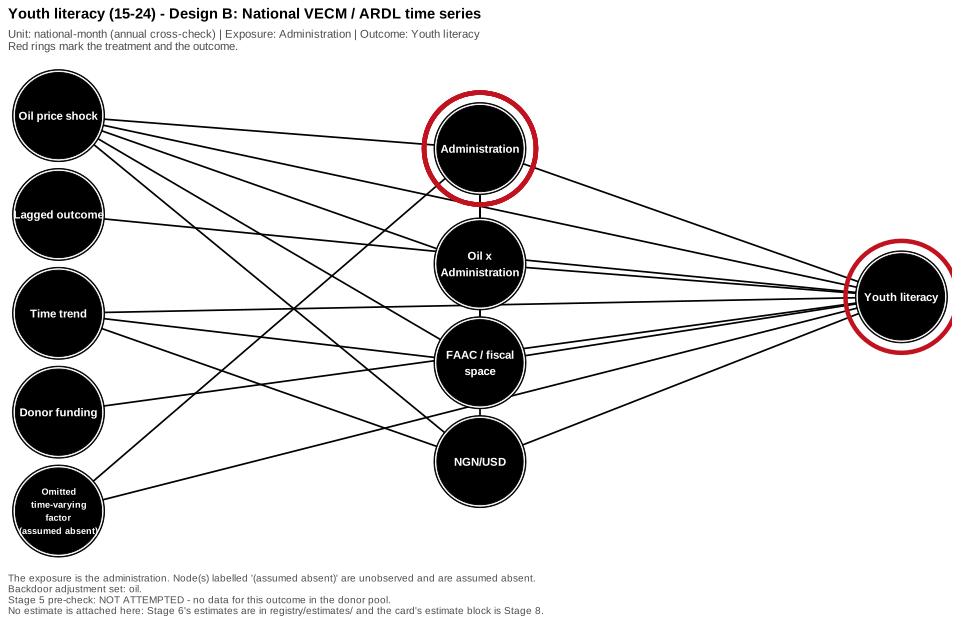
Conditional exogeneity: given the oil price, the lagged outcome, fiscal and FX controls and the trend, the administration dummy is unrelated to any remaining time-varying determinant of the outcome (the unobserved node is absent).
Maternal mortality ratio
C · Synthetic control (cross-country)
The assumption
The synthetic control reproduces Nigeria's outcome path absent treatment: donor-weighted common factors (above all the global oil and commodity cycle) stand in for Nigeria's counterfactual, and no Nigeria-specific shock coincides with the treatment (the unobserved node is absent).
Adjustment set (what the comparison holds fixed)
Common factors (global oil / commodity cycle) (common)
Assumed absent (the thing that must not exist)
Nigeria-specific shock coinciding with treatment (u_ng)
What this cannot rule out (what could still spoil it)
Five treated tenures is a small treated set — the donor pool cannot always buy a credible counterfactual.
Sparse pre-treatment fit weakens the comparison, and the card must say so rather than ship the gap.
Contemporaneous global shocks affect donors differently than Nigeria even when the oil channel is shared.
The other graphs for this outcomethe check it needed failed
A · State dose-response DiD
Parallel trends: absent the policy shift, states with different exposure intensities would have followed parallel outcome paths. Formally, no unmeasured state-by-time confounder affects both the dose and the outcome (the unobserved node is absent).
usable with a warning
B · National VECM / ARDL time series
Conditional exogeneity: given the oil price, the lagged outcome, fiscal and FX controls and the trend, the administration dummy is unrelated to any remaining time-varying determinant of the outcome (the unobserved node is absent).
Penta3 immunisation coverage
B · National VECM / ARDL time series
The assumption
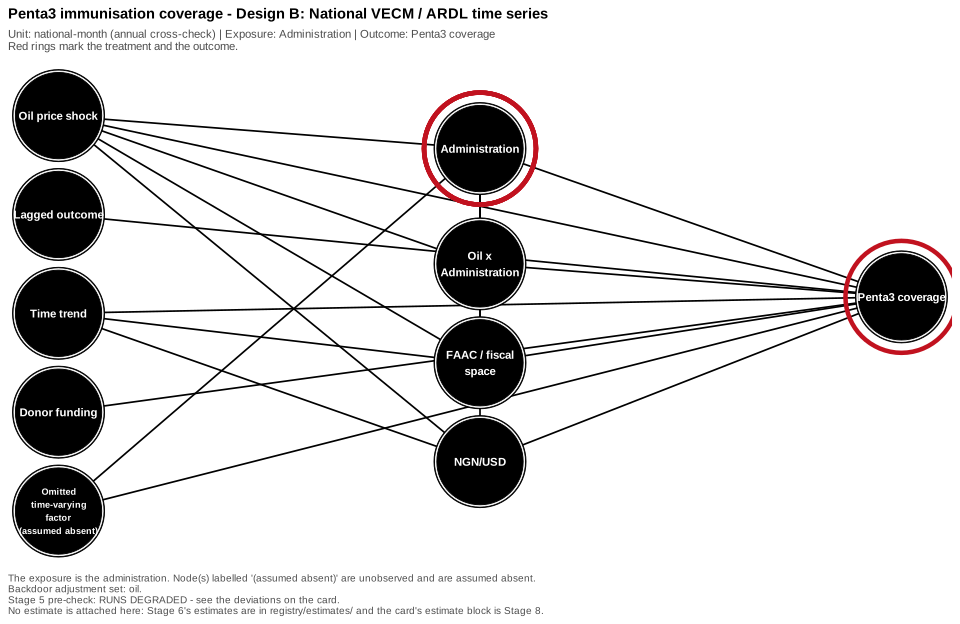
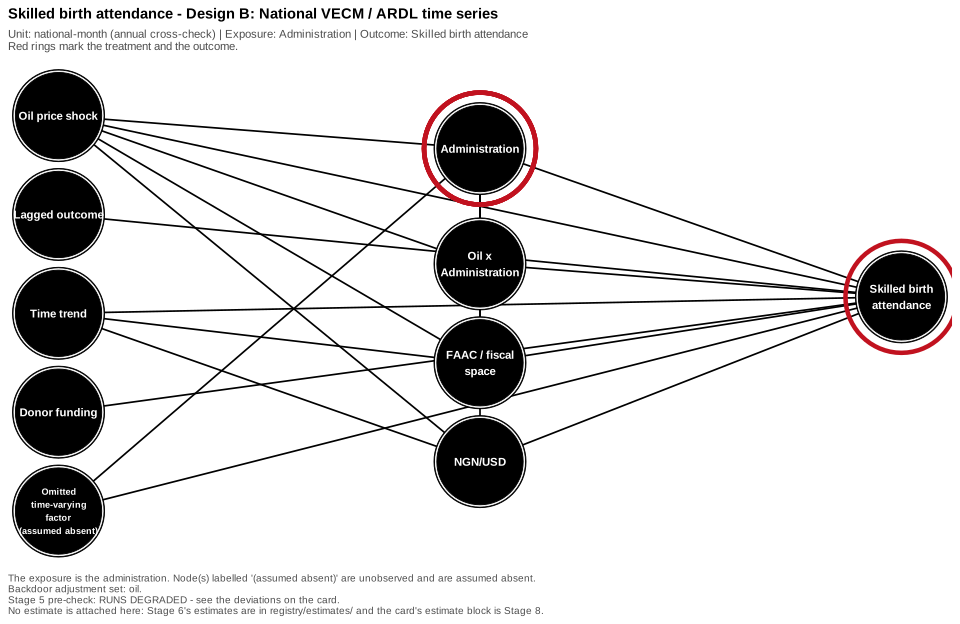
Conditional exogeneity: given the oil price, the lagged outcome, fiscal and FX controls and the trend, the administration dummy is unrelated to any remaining time-varying determinant of the outcome (the unobserved node is absent).
Adjustment set (what the comparison holds fixed)
Brent crude price (logged) (oil)
Assumed absent (the thing that must not exist)
Omitted time-varying determinant (u_t)
What this cannot rule out (what could still spoil it)
FAAC and the exchange rate are downstream of the administration, so conditioning on them identifies a *direct* effect net of the fiscal and FX channel, not the total effect.
Only ~26 annual observations and five administrations — the interval is wide by construction.
Structural breaks (2014 rebasing, 2016 and 2023 regime changes) are not fully absorbed by trends.
Oil is treated as exogenous to Nigerian policy, which the 2016 and 2020 episodes roughly support but do not prove.
The other graphs for this outcomethe check it needed failed
A · State dose-response DiD
Parallel trends: absent the policy shift, states with different exposure intensities would have followed parallel outcome paths. Formally, no unmeasured state-by-time confounder affects both the dose and the outcome (the unobserved node is absent).
the check it needed failed
C · Synthetic control (cross-country)
The synthetic control reproduces Nigeria's outcome path absent treatment: donor-weighted common factors (above all the global oil and commodity cycle) stand in for Nigeria's counterfactual, and no Nigeria-specific shock coincides with the treatment (the unobserved node is absent).
Skilled birth attendance
B · National VECM / ARDL time series
The assumption
Conditional exogeneity: given the oil price, the lagged outcome, fiscal and FX controls and the trend, the administration dummy is unrelated to any remaining time-varying determinant of the outcome (the unobserved node is absent).
Adjustment set (what the comparison holds fixed)
Brent crude price (logged) (oil)
Assumed absent (the thing that must not exist)
Omitted time-varying determinant (u_t)
What this cannot rule out (what could still spoil it)
FAAC and the exchange rate are downstream of the administration, so conditioning on them identifies a *direct* effect net of the fiscal and FX channel, not the total effect.
Only ~26 annual observations and five administrations — the interval is wide by construction.
Structural breaks (2014 rebasing, 2016 and 2023 regime changes) are not fully absorbed by trends.
Oil is treated as exogenous to Nigerian policy, which the 2016 and 2020 episodes roughly support but do not prove.
The other graphs for this outcomethe check it needed failed
A · State dose-response DiD
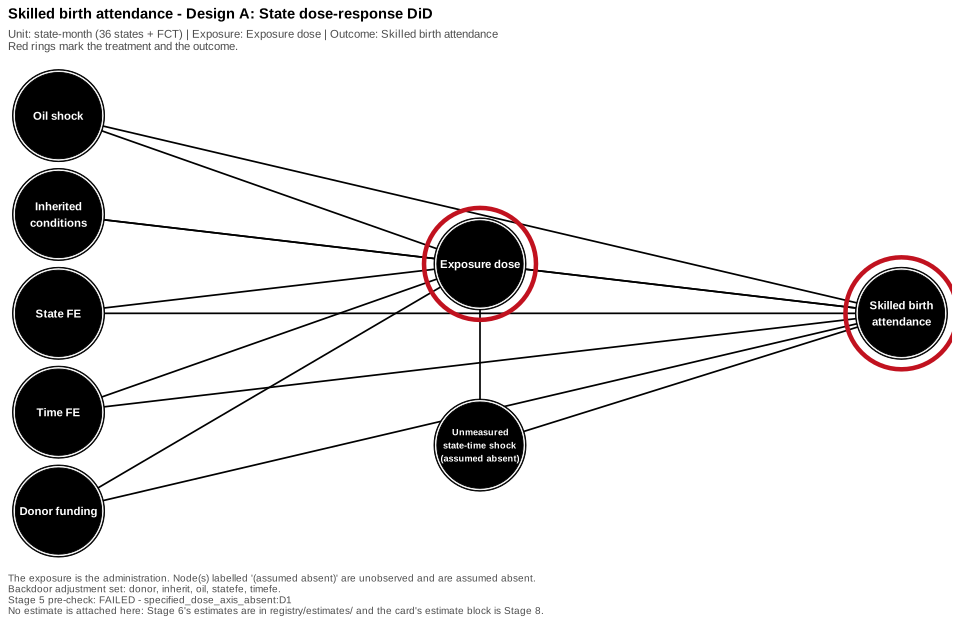
Parallel trends: absent the policy shift, states with different exposure intensities would have followed parallel outcome paths. Formally, no unmeasured state-by-time confounder affects both the dose and the outcome (the unobserved node is absent).
not attempted
C · Synthetic control (cross-country)
The synthetic control reproduces Nigeria's outcome path absent treatment: donor-weighted common factors (above all the global oil and commodity cycle) stand in for Nigeria's counterfactual, and no Nigeria-specific shock coincides with the treatment (the unobserved node is absent).
Youth literacy (15-24)
A · State dose-response DiD
The assumption
Parallel trends: absent the policy shift, states with different exposure intensities would have followed parallel outcome paths. Formally, no unmeasured state-by-time confounder affects both the dose and the outcome (the unobserved node is absent).
Adjustment set (what the comparison holds fixed)
Donor-funded programmes (donor)
Inherited state conditions (inherit)
Brent crude shock (oil)
State fixed effect (statefe)
Time fixed effect (timefe)
Assumed absent (the thing that must not exist)
Unmeasured state-by-time shock (u_st)
What this cannot rule out (what could still spoil it)
Anticipation: states may adjust behaviour before the formal policy date.
SUTVA violations through cross-state spillovers (trade, migration, security).
Compositional or definitional change in state accounts over the window.
The dose itself (D1, FAAC per capita) may be contaminated by the policy it measures.
The other graphs for this outcomenot attempted
B · National VECM / ARDL time series
Conditional exogeneity: given the oil price, the lagged outcome, fiscal and FX controls and the trend, the administration dummy is unrelated to any remaining time-varying determinant of the outcome (the unobserved node is absent).
not attempted
C · Synthetic control (cross-country)
The synthetic control reproduces Nigeria's outcome path absent treatment: donor-weighted common factors (above all the global oil and commodity cycle) stand in for Nigeria's counterfactual, and no Nigeria-specific shock coincides with the treatment (the unobserved node is absent).
Primary completion rate
A · State dose-response DiD
The assumption
Parallel trends: absent the policy shift, states with different exposure intensities would have followed parallel outcome paths. Formally, no unmeasured state-by-time confounder affects both the dose and the outcome (the unobserved node is absent).
Adjustment set (what the comparison holds fixed)
Donor-funded programmes (donor)
Inherited state conditions (inherit)
Brent crude shock (oil)
State fixed effect (statefe)
Time fixed effect (timefe)
Assumed absent (the thing that must not exist)
Unmeasured state-by-time shock (u_st)
What this cannot rule out (what could still spoil it)
Anticipation: states may adjust behaviour before the formal policy date.
SUTVA violations through cross-state spillovers (trade, migration, security).
Compositional or definitional change in state accounts over the window.
The dose itself (D1, FAAC per capita) may be contaminated by the policy it measures.
The other graphs for this outcomenot attempted
B · National VECM / ARDL time series
Conditional exogeneity: given the oil price, the lagged outcome, fiscal and FX controls and the trend, the administration dummy is unrelated to any remaining time-varying determinant of the outcome (the unobserved node is absent).
not attempted
C · Synthetic control (cross-country)
The synthetic control reproduces Nigeria's outcome path absent treatment: donor-weighted common factors (above all the global oil and commodity cycle) stand in for Nigeria's counterfactual, and no Nigeria-specific shock coincides with the treatment (the unobserved node is absent).
Net enrolment rate, primary
A · State dose-response DiD
The assumption
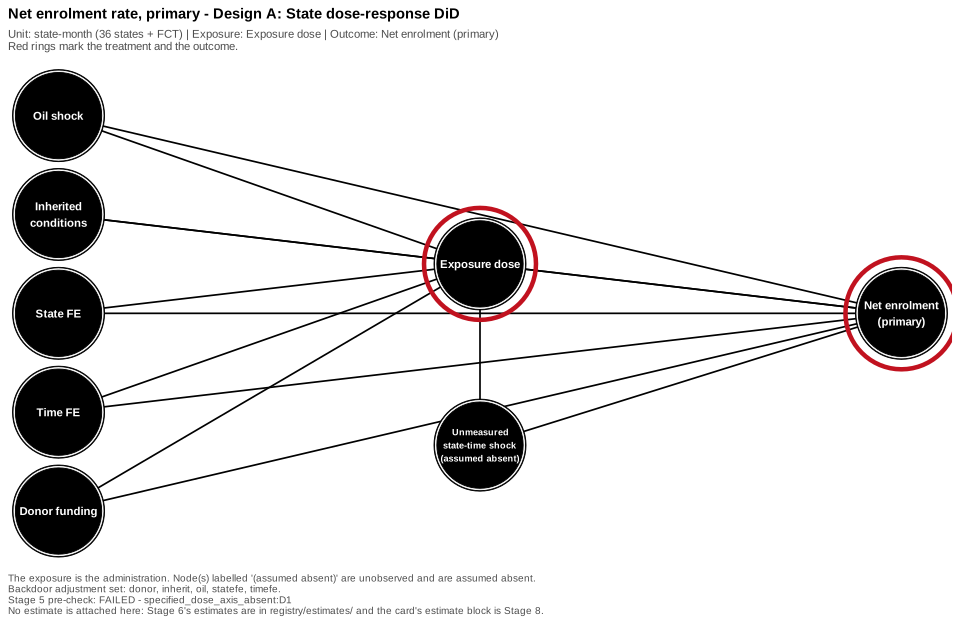
Parallel trends: absent the policy shift, states with different exposure intensities would have followed parallel outcome paths. Formally, no unmeasured state-by-time confounder affects both the dose and the outcome (the unobserved node is absent).
Adjustment set (what the comparison holds fixed)
Donor-funded programmes (donor)
Inherited state conditions (inherit)
Brent crude shock (oil)
State fixed effect (statefe)
Time fixed effect (timefe)
Assumed absent (the thing that must not exist)
Unmeasured state-by-time shock (u_st)
What this cannot rule out (what could still spoil it)
Anticipation: states may adjust behaviour before the formal policy date.
SUTVA violations through cross-state spillovers (trade, migration, security).
Compositional or definitional change in state accounts over the window.
The dose itself (D1, FAAC per capita) may be contaminated by the policy it measures.
The other graphs for this outcomenot attempted
B · National VECM / ARDL time series
Conditional exogeneity: given the oil price, the lagged outcome, fiscal and FX controls and the trend, the administration dummy is unrelated to any remaining time-varying determinant of the outcome (the unobserved node is absent).
not attempted
C · Synthetic control (cross-country)
The synthetic control reproduces Nigeria's outcome path absent treatment: donor-weighted common factors (above all the global oil and commodity cycle) stand in for Nigeria's counterfactual, and no Nigeria-specific shock coincides with the treatment (the unobserved node is absent).
Reported security fatalities
A · State dose-response DiD
The assumption
Parallel trends: absent the policy shift, states with different exposure intensities would have followed parallel outcome paths. Formally, no unmeasured state-by-time confounder affects both the dose and the outcome (the unobserved node is absent).
Adjustment set (what the comparison holds fixed)
Inherited state conditions (inherit)
Brent crude shock (oil)
State fixed effect (statefe)
Time fixed effect (timefe)
Assumed absent (the thing that must not exist)
Unmeasured state-by-time shock (u_st)
What this cannot rule out (what could still spoil it)
Anticipation: states may adjust behaviour before the formal policy date.
SUTVA violations through cross-state spillovers (trade, migration, security).
Compositional or definitional change in state accounts over the window.
The dose itself (D1, FAAC per capita) may be contaminated by the policy it measures.
The other graphs for this outcomeusable with a warning
B · National VECM / ARDL time series
Conditional exogeneity: given the oil price, the lagged outcome, fiscal and FX controls and the trend, the administration dummy is unrelated to any remaining time-varying determinant of the outcome (the unobserved node is absent).
not attempted
C · Synthetic control (cross-country)
The synthetic control reproduces Nigeria's outcome path absent treatment: donor-weighted common factors (above all the global oil and commodity cycle) stand in for Nigeria's counterfactual, and no Nigeria-specific shock coincides with the treatment (the unobserved node is absent).
Reported security incidents
A · State dose-response DiD
The assumption
Parallel trends: absent the policy shift, states with different exposure intensities would have followed parallel outcome paths. Formally, no unmeasured state-by-time confounder affects both the dose and the outcome (the unobserved node is absent).
Adjustment set (what the comparison holds fixed)
Inherited state conditions (inherit)
Brent crude shock (oil)
State fixed effect (statefe)
Time fixed effect (timefe)
Assumed absent (the thing that must not exist)
Unmeasured state-by-time shock (u_st)
What this cannot rule out (what could still spoil it)
Anticipation: states may adjust behaviour before the formal policy date.
SUTVA violations through cross-state spillovers (trade, migration, security).
Compositional or definitional change in state accounts over the window.
The dose itself (D1, FAAC per capita) may be contaminated by the policy it measures.
The other graphs for this outcomeusable with a warning
B · National VECM / ARDL time series
Conditional exogeneity: given the oil price, the lagged outcome, fiscal and FX controls and the trend, the administration dummy is unrelated to any remaining time-varying determinant of the outcome (the unobserved node is absent).
not attempted
C · Synthetic control (cross-country)
The synthetic control reproduces Nigeria's outcome path absent treatment: donor-weighted common factors (above all the global oil and commodity cycle) stand in for Nigeria's counterfactual, and no Nigeria-specific shock coincides with the treatment (the unobserved node is absent).
Real GDP growth (y/y)
B · National VECM / ARDL time series
The assumption
Conditional exogeneity: given the oil price, the lagged outcome, fiscal and FX controls and the trend, the administration dummy is unrelated to any remaining time-varying determinant of the outcome (the unobserved node is absent).
Adjustment set (what the comparison holds fixed)
Brent crude price (logged) (oil)
Assumed absent (the thing that must not exist)
Omitted time-varying determinant (u_t)
What this cannot rule out (what could still spoil it)
FAAC and the exchange rate are downstream of the administration, so conditioning on them identifies a *direct* effect net of the fiscal and FX channel, not the total effect.
Only ~26 annual observations and five administrations — the interval is wide by construction.
Structural breaks (2014 rebasing, 2016 and 2023 regime changes) are not fully absorbed by trends.
Oil is treated as exogenous to Nigerian policy, which the 2016 and 2020 episodes roughly support but do not prove.
The other graphs for this outcomethe check it needed failed
A · State dose-response DiD
Parallel trends: absent the policy shift, states with different exposure intensities would have followed parallel outcome paths. Formally, no unmeasured state-by-time confounder affects both the dose and the outcome (the unobserved node is absent).
the check it needed failed
C · Synthetic control (cross-country)
The synthetic control reproduces Nigeria's outcome path absent treatment: donor-weighted common factors (above all the global oil and commodity cycle) stand in for Nigeria's counterfactual, and no Nigeria-specific shock coincides with the treatment (the unobserved node is absent).
Headline inflation (y/y)
B · National VECM / ARDL time series
The assumption
Conditional exogeneity: given the oil price, the lagged outcome, fiscal and FX controls and the trend, the administration dummy is unrelated to any remaining time-varying determinant of the outcome (the unobserved node is absent).
Adjustment set (what the comparison holds fixed)
Brent crude price (logged) (oil)
Assumed absent (the thing that must not exist)
Omitted time-varying determinant (u_t)
What this cannot rule out (what could still spoil it)
FAAC and the exchange rate are downstream of the administration, so conditioning on them identifies a *direct* effect net of the fiscal and FX channel, not the total effect.
Only ~26 annual observations and five administrations — the interval is wide by construction.
Structural breaks (2014 rebasing, 2016 and 2023 regime changes) are not fully absorbed by trends.
Oil is treated as exogenous to Nigerian policy, which the 2016 and 2020 episodes roughly support but do not prove.
The other graphs for this outcomethe check it needed failed
A · State dose-response DiD
Parallel trends: absent the policy shift, states with different exposure intensities would have followed parallel outcome paths. Formally, no unmeasured state-by-time confounder affects both the dose and the outcome (the unobserved node is absent).
the check it needed failed
C · Synthetic control (cross-country)
The synthetic control reproduces Nigeria's outcome path absent treatment: donor-weighted common factors (above all the global oil and commodity cycle) stand in for Nigeria's counterfactual, and no Nigeria-specific shock coincides with the treatment (the unobserved node is absent).
Unemployment rate
C · Synthetic control (cross-country)
The assumption
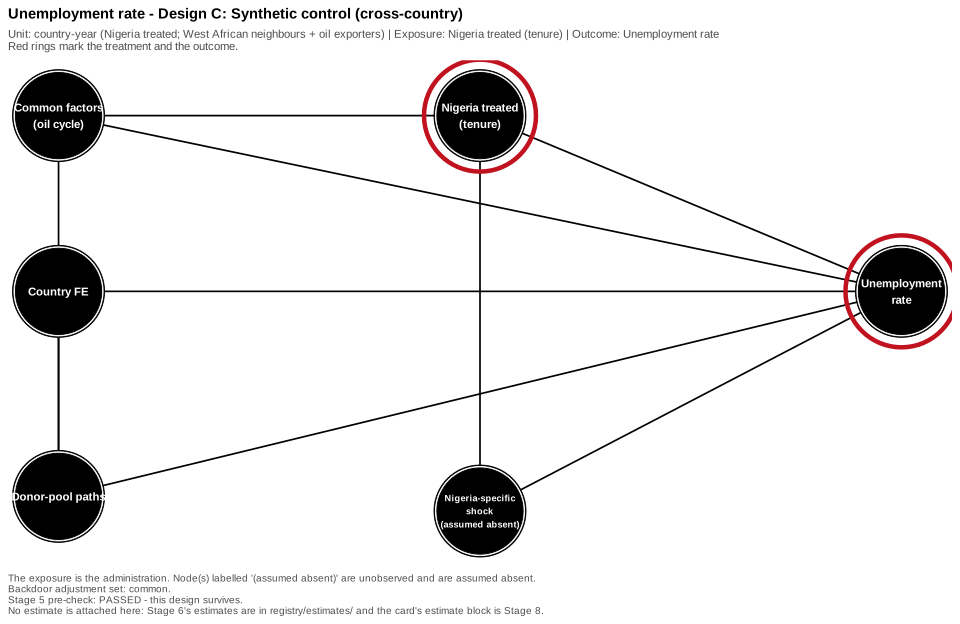
The synthetic control reproduces Nigeria's outcome path absent treatment: donor-weighted common factors (above all the global oil and commodity cycle) stand in for Nigeria's counterfactual, and no Nigeria-specific shock coincides with the treatment (the unobserved node is absent).
Adjustment set (what the comparison holds fixed)
Common factors (global oil / commodity cycle) (common)
Assumed absent (the thing that must not exist)
Nigeria-specific shock coinciding with treatment (u_ng)
What this cannot rule out (what could still spoil it)
Five treated tenures is a small treated set — the donor pool cannot always buy a credible counterfactual.
Sparse pre-treatment fit weakens the comparison, and the card must say so rather than ship the gap.
Contemporaneous global shocks affect donors differently than Nigeria even when the oil channel is shared.
The other graphs for this outcomethe check it needed failed
A · State dose-response DiD
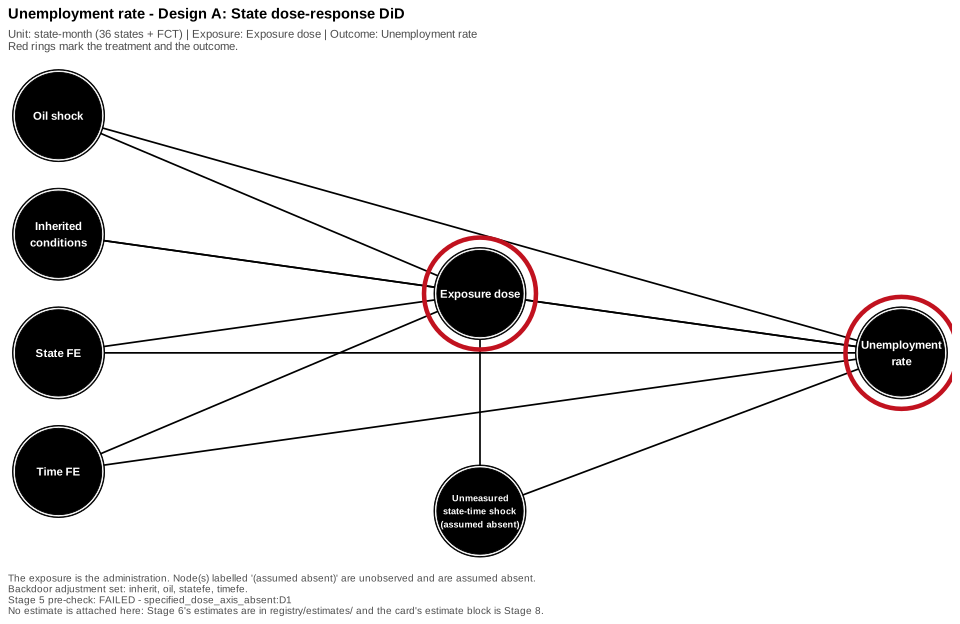
Parallel trends: absent the policy shift, states with different exposure intensities would have followed parallel outcome paths. Formally, no unmeasured state-by-time confounder affects both the dose and the outcome (the unobserved node is absent).
usable with a warning
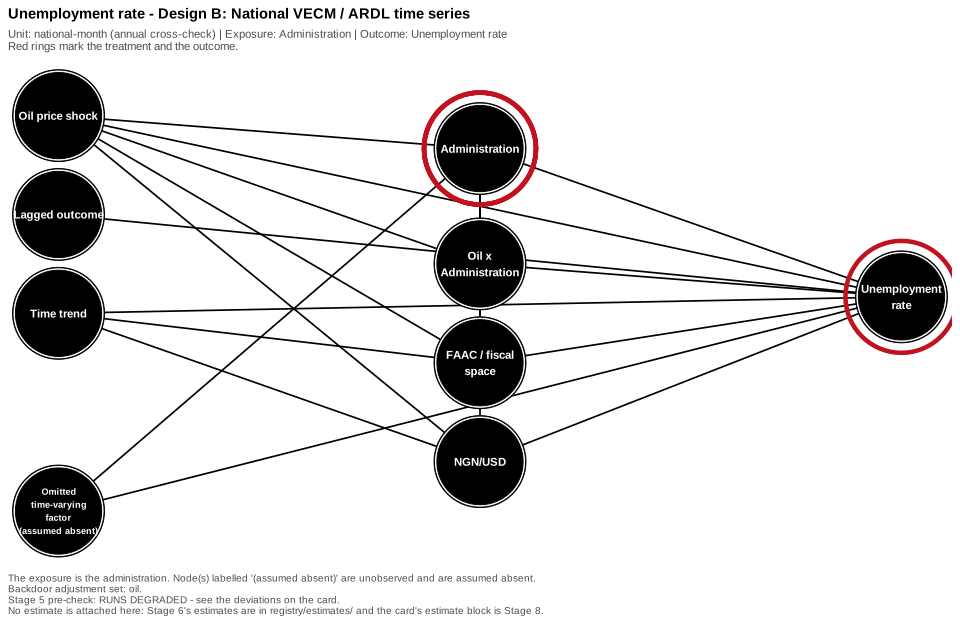
B · National VECM / ARDL time series
Conditional exogeneity: given the oil price, the lagged outcome, fiscal and FX controls and the trend, the administration dummy is unrelated to any remaining time-varying determinant of the outcome (the unobserved node is absent).