RoadSense Nigeria · measured
A satellite can show you a bad road. It could not show you a road getting worse.
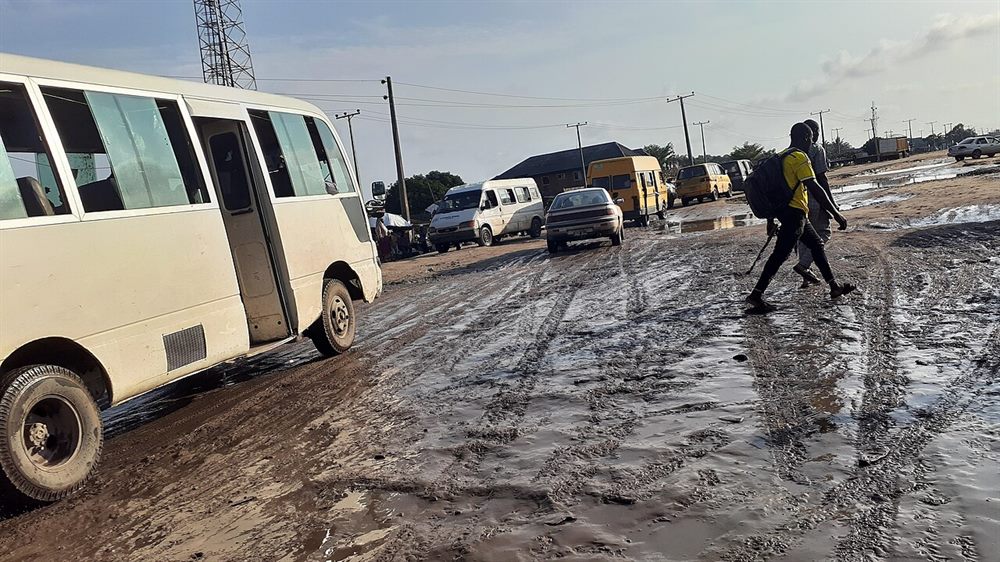
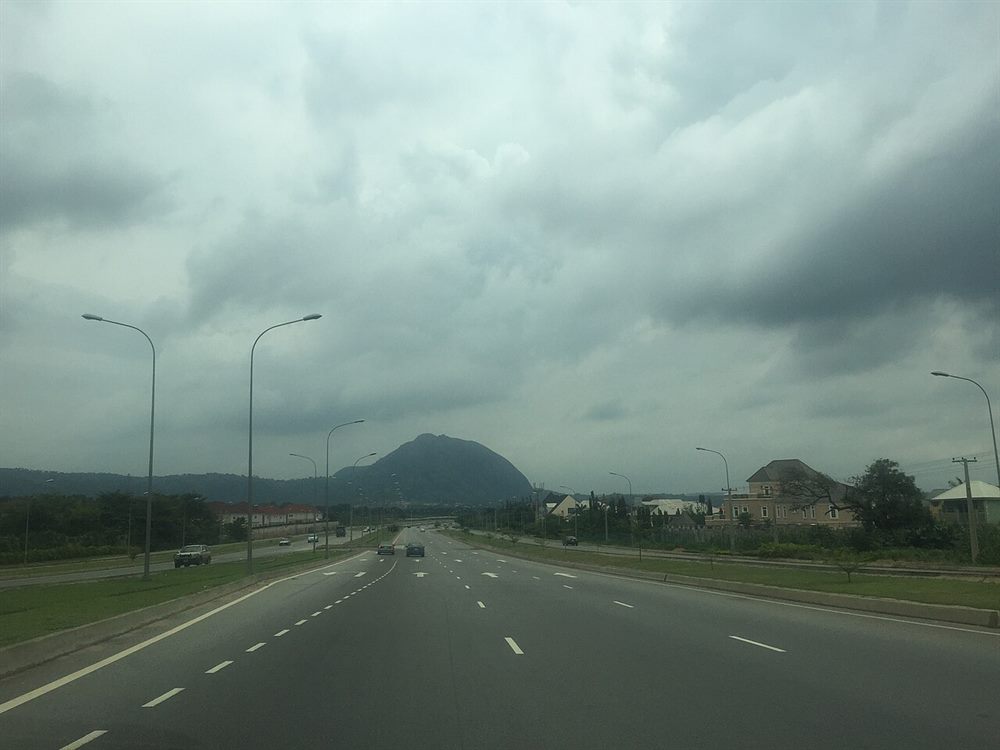
Only 30 per cent of Nigeria's roads are paved, according to the World Bank. The rest are earth, gravel, or something a lorry leaves behind in the rain. The two photographs above are the ends of that range: a Lagos street where buses and vans nose through standing water, and a dual carriageway outside Abuja, empty, lit and drained.
A photograph tells you which of those two a road is on the day somebody pressed the shutter. It cannot tell you which way the road is going. The flooded street may flood every rainy season and be no worse than it was ten years ago. The clean carriageway may be quietly losing its verge, year by year, in a way no single picture would ever show.
In 2017 the World Bank put 40 per cent of federal roads in poor condition. That is one year's reading, not a trend, and it says nothing about any particular road. What a maintenance budget needs to know is different: of the 850 stretches of federal highway measured here — 18,419 km of road, each stretch long enough to have a name and a budget line — which ones are getting worse?
What the record says
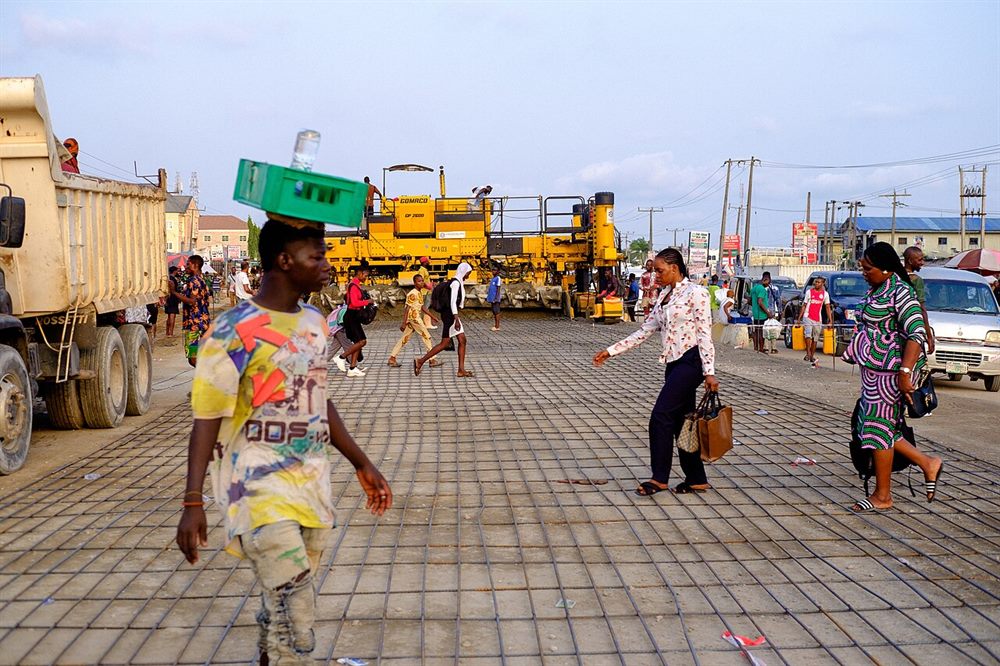
Nigeria's procurement record is the only national paper trail of road spending. It names a road, a state, a kind of work, an amount and a date: money allocated.
It does not say whether the road got better. A contract records a promise, and a commissioning ceremony is a photograph of a promise, nothing more. The money may have reached the road, part of it, or none of it.
The record shows where money moved; satellite imagery shows what the ground did. The test below asks whether the second predicts the first.
The result
Can a free satellite photograph tell a road agency which of its roads are falling apart? This page reports the attempt: 850 stretches of Nigerian federal highway, 22 months, and one test that was written down before it was run. The test failed.
0.3901the score. Half, 0.50, is a coin toss
- Plausible range
- 0.3196 to 0.4671
- Bar to clear
- 0.60 point estimate, with the lower end above 0.50
- Direction
- below a coin toss (0.50): roads with recorded spending score as less degraded than roads without
- Sample
- 644 roads compared, 66 of them with a payment on record, 578 without
The number is a ranking score, and it is worth saying plainly what it ranks. Take two roads, one with a payment on record and one without. A score of 0.50 means the measure picks between them no better than a coin. Above that, it usually picks the funded road as the one in worse shape. Below it, it picks the funded road as the one in better shape — which is what happened here. So the failure is not "the effect is small". It is "the measure points the wrong way", and a measure that points the wrong way cannot be used to send crews anywhere.
The five figures
The map: movement, not condition
Across 850 corridors over 10 months, 69 fell, 347 rose and 434 stayed within 0.01 of zero either way. The outer band starts at 0.02, the ninetieth percentile of absolute movement.
- contrast falling by 0.02 or more — 27 corridors
- contrast falling by 0.01 to 0.02 — 42 corridors
- steady, within 0.01 either way — 434 corridors
- contrast rising by 0.01 to 0.02 — 202 corridors
- contrast rising by 0.02 or more — 145 corridors
- no usable change value — 0 corridors
- value from fewer than 10 monthly values — 48 corridors, dotted outline
This shows movement, not condition. A corridor that has always been poor and one that has always been good look the same here. It cannot rank roads against each other nationally.
Shows: the mean year-over-year change in the gap between the road and its verge for each corridor, over the 10 months where a year-earlier pair exists (2025-09 to 2026-06). The comparison is each corridor against itself, the same calendar month one year earlier, so a road's own level is differenced out and the season is held fixed: a corridor that did not move sits at zero by construction, and the grey centre band reads “no change against that reference”, never “a good road”. 0 corridors have no usable change value and are drawn in neutral grey rather than given a colour; 48 rest on fewer than 10 monthly values and carry a dotted outline. 63 corridor-months inside the window carry no value and are left out, not interpolated (183 across the whole panel). Does not show: current condition, or that a dark violet corridor is in worse shape today than a dark blue one — only that its contrast moved further in one direction over the period.The same numbers as a table
| Band | Corridors |
|---|---|
| contrast falling by 0.02 or more | 27 |
| contrast falling by 0.01 to 0.02 | 42 |
| steady, within 0.01 either way | 434 |
| contrast rising by 0.01 to 0.02 | 202 |
| contrast rising by 0.02 or more | 145 |
| no usable change value | 0 |
The map is one SVG drawn from 127,091 source vertices, simplified to 110,003 for this page at a tolerance of about half a display pixel, and clipped to the corridor bounding box (11.8 degrees of longitude, 9.1 of latitude).
The same numbers as a table
| Month | Mean contrast |
|---|---|
| 2024-09 | 0.1156 |
| 2024-10 | 0.0951 |
| 2024-11 | 0.0814 |
| 2024-12 | 0.0713 |
| 2025-01 | 0.0647 |
| 2025-02 | 0.0708 |
| 2025-03 | 0.0863 |
| 2025-04 | 0.0965 |
| 2025-05 | 0.1023 |
| 2025-06 | 0.1121 |
| 2025-07 | 0.1243 |
| 2025-08 | 0.1330 |
| 2025-09 | 0.1235 |
| 2025-10 | 0.1075 |
| 2025-11 | 0.0914 |
| 2025-12 | 0.0814 |
| 2026-01 | 0.0751 |
| 2026-02 | 0.0785 |
| 2026-03 | 0.0902 |
| 2026-04 | 0.1017 |
| 2026-05 | 0.1101 |
| 2026-06 | 0.1233 |
The same numbers as a table
| Score value | Corridors |
|---|---|
| 0.000241 | 726 |
| -0.001054 | 60 |
| -0.001008 | 17 |
| -0.002912 | 12 |
| -0.002431 | 7 |
| every other value | 28 |
Distinct values at full precision: 168 across 850 scored corridors; histogram drawn with 20 equal bins between -0.0071 and 0.0015.
The same numbers as a table
| Instrument | AUC | Interval | Analysed | Labelled | Unlabelled | Permutation p |
|---|---|---|---|---|---|---|
| Primary / year-over-year | 0.3901 | 0.3196 to 0.4671 | 644 | 66 | 578 | 0.00 |
| Secondary / 15-month trend | 0.4318 | 0.3544 to 0.5137 | 644 | 66 | 578 | 0.08 |
| Reference / raw level | 0.3133 | 0.2461 to 0.3881 | 644 | 66 | 578 | 0.00 |
The same numbers as a table
| Component | Share of total |
|---|---|
| Month, entered first | 5.9% |
| Corridor, entered second | 81.2% |
| Residual | 12.8% |
| Corridor first instead | 82.1% |
| Month second instead | 5.1% |
| Corridor-months used | 18,517 |
How the measurement was made
For each corridor and each month, the mean vegetation index of a band along the carriageway is subtracted from the mean of the verge beside it, at 10 metre resolution, from Sentinel-2 via the DE Africa platform. That gives one value per corridor per month: 18,700 corridor-months over 22 months, with 183 left blank rather than filled.
| Check | Result |
|---|---|
| Imagery months present | 22 of 22, 0 missing |
| Imagery rows, corridors, duplicate keys | 69,212, 850, 0 |
| Weather rows, missing, nulls | 18,700, 0, 0 |
| Score varies, all three instruments | 850 distinct values each, 0.1% on the modal value |
| Score is not a proxy for coverage | correlation -0.0123, AUC 0.5089 |
| Decision rule, written before the test | 0.60 point estimate, lower bound above 0.50 |
The test asks whether the contrast falls faster on corridors with a procurement record than on comparable corridors without one. Corridors are matched exactly on road class and on length band within class; the statistic is the probability that a labelled corridor ranks as more degraded than an unlabelled one, with a bootstrap interval and a permutation null. The bar was written down before the test ran, and was not lowered after it failed.
What this does not claim
Four things this does not claim.
- Movement, not condition. The score has no level: a corridor that was always bad and one that never changed can produce the same value.
- Federal corridors only. The network is the named federal highways; feeder roads, which carry much of the traffic, are not in it.
- Reanalysis, not gauges. The rainfall covariate is a gridded reanalysis product, not a rain gauge, and it is context rather than a measured cause.
- Observational, not causal. 66 labelled corridors is a small, non-random, spending-driven sample. A procurement record is evidence that money was allocated, never that a road failed.
Where the numbers come from
Every figure on this page is emitted by the script that built it and re-checked on each build against the file it came from; a number typed by hand would fail the build. The code, data manifests and findings register are on GitHub.
Credits
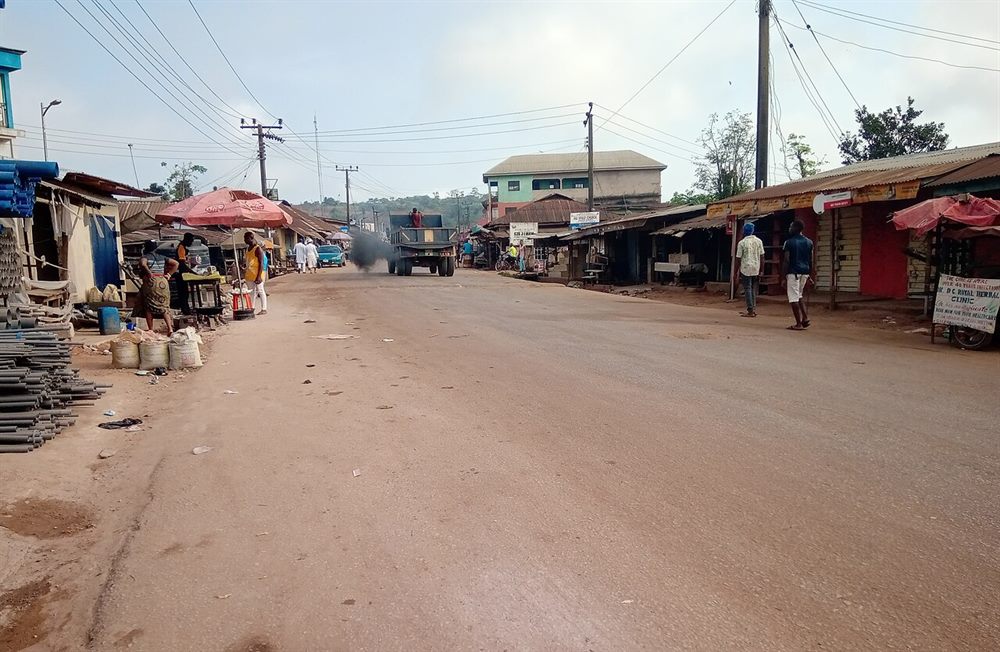
- Photographs. Tunde Olowookere (a Lagos road, 2020); Taini Ozeto (dual carriageway outside Abuja); Ayodele Adeniji (concrete in Bogije, Lagos); Okechukwu Iroegbu (an earth road through a market at Akara); Ifexmeco (the dual carriageway that runs behind the page, sand-storm light and all). All five images are CC BY-SA 4.0; each caption above carries its own credit.
- Outside figures. 30 per cent of the road network paved, and 40 per cent of federal roads in poor condition in 2017: World Bank, Nigeria Project Information Document, P180640, footnote 5 citing the Systematic Country Diagnostic (2020), downloaded 2026-11-09. The document.
- Licensing. Photographs CC BY-SA 4.0; the page text and the code that builds it MIT; the tables of derived numbers CC BY-SA 4.0.